The Case for Arena Resources Inc.
Why ARD Shareholders will be Richly Rewarded
The last few weeks I have taken the time to do something I enjoy. One of the things I enjoy doing is researching companies and digging through SEC filings. I research companies I own as well as prospective companies I might like to own. In the process of my research I have also data mined some companies that I do not own and do not intend to own. The reason for all this research is not just because I enjoy doing it but also because I want to know if my money is well invested. This process involves not only knowing my companies forward and backwards but also being able to compare the companies I"m invested in with other similar companies. This process of comparing companies is often times referred to as benchmarking. Benchmarking not only tells me how my company stacks up against the competition fundamentally but also in terms of valuation. The conclusions that I have drawn from this research is that ARD is a strong company both fundamentally and operationally and is extremely undervalued in relation to other oil and gas companies.
Now the Fun Part...
Now I'd like to make the case for Arena Resources: Ticker Symbol ARD. I'd like to present the evidence that leads me to believe that ARD shareholders will be richly rewarded both short-term and long-term (especially long-term.)
Below you will see how ARD lifting Costs have increased virtually doubling each of the last two years. We are on pace to double the lifting costs again in 2005.
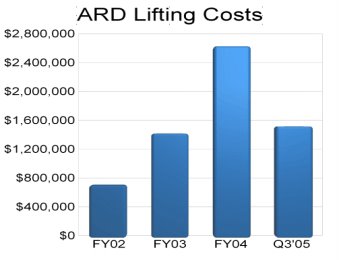
The increased lifting costs in the chart above is a result of increasing oil and gas production. The increased oil and gas production means that the increased costs are spread out over a larger production base. Dividing total oil and gas lifting costs (costs to produce) by total production we get the ARD lifting costs per BOE figures as listed below.
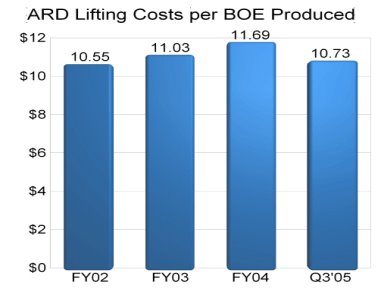
In the chart above please note the decrease in lifting costs per BOE means that the ARD cost structure out at the field is improving below what is already a very low cost structure.
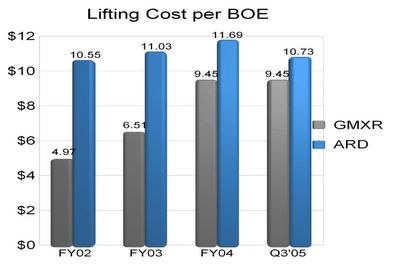
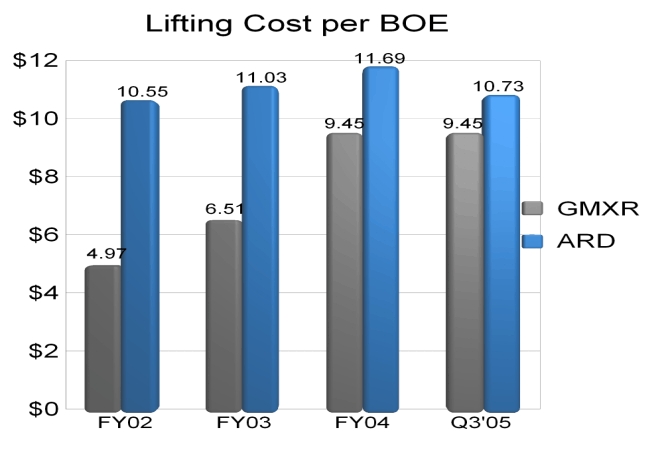
Here is how ARD compares to a company that produces mostly gas. Gas production is well know to have lower cost structures than companies that produce mostly oil. ARD produces mostly oil.
(click on image to enlarge.)
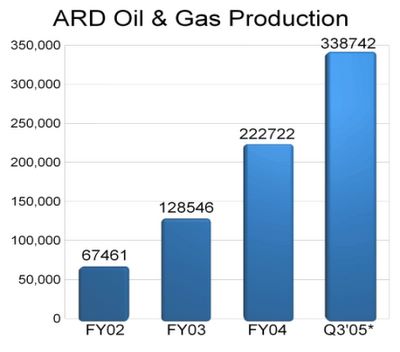
You should note that the difference between the lifting costs of ARD and GMXR have been narrowing. It is great to see that the ARD cost structure is nearly that of a gas producer. This speaks volumes about the tight cost controls at Arena Resources. The driver behind the decrease in lifting costs per BOE is not only a result of tight cost controls but also the explosion in oil and gas production as noted in the chart below.
(click on image to enlarge.)
The increase in oil and gas production in 2005 is on pace to more than double that which was produced in FY2004. The Q3'05 figure in the chart above is for the first nine months of 2005. Production is not only doubling but it has been doing so since FY2002. In other words, this incredible record of production growth has been going on since almost the inception of ARD.
The chart below show just how strong Arena Resources Production is when it is compared to the production history of another popular oil and gas company. The Q3'05 figure in the chart below is for the first nine months of 2005.
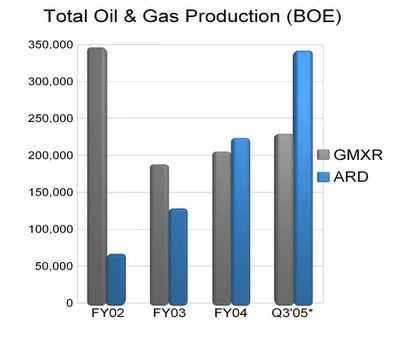
(Click on image to enlarge.)
GMXR does not have a spectacular production history. In contrast ARD has a spectacular production history.
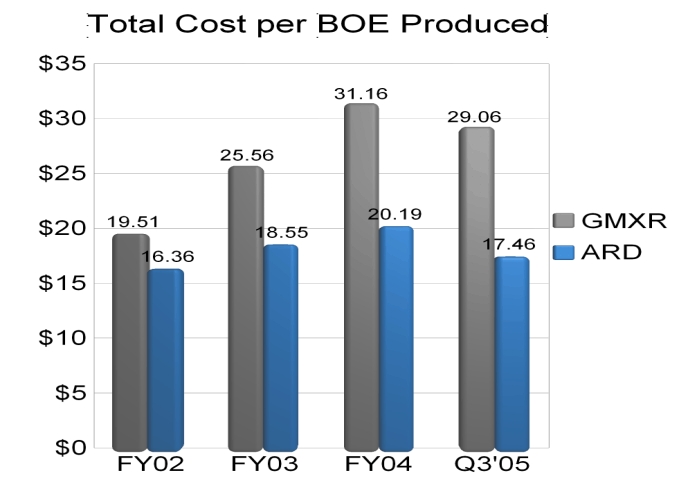
When we add in depreciation, depletion and amortization (DD&A) along with general and administrative costs (G&A) to the lifting costs noted above we arrive at the total costs in oil production. How high are ARD total costs and how do they compare to GMXR (produces mostly gas)? The chart below is worth a thousand words.

(Click on image to enlarge.)
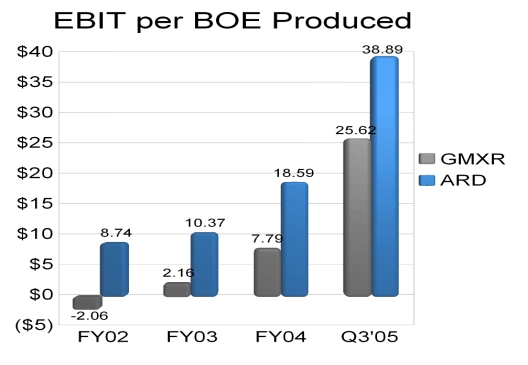
The fact that ARD produces oil and gas with a cost structure on a per BOE basis that is nearly $12 less than GMXR is nothing short of amazing. The fact that ARD has an impossibly low cost structure means that it also has an impossibly high EBIT per BOE produced. (EBIT means Earnings Before Income Taxes.) How much money before taxes is ARD making? How does it stack up against GMXR? Lets take a look at the chart below.

(Click on image to enlarge.)
The above chart indicates that ARD EBIT per BOE produced is not only increasing rapidly but it has been superior to that of GMXR dating back to FY2002. ARD is a superior company to GMXR in terms of EBIT per BOE produced not only in the latest quarter but also for every period measured dating back to FY2002. If you take EBIT per BOE and production growth into account it is clear that ARD will be EXPLOSIVE in terms of earnings potential. ARD trumps the very popular GMXR not only in terms of EBIT per BOE produced but also in terms of production and production growth. The historical trends and expected future trends favor ARD.
Measuring ARD Valuation
Valuation models allow the measurement of value. Since investors value oil companies based on their production and oil reserves I have two models that I employ. The first uses production as a metric of valuation.
Valuation in Terms of Production
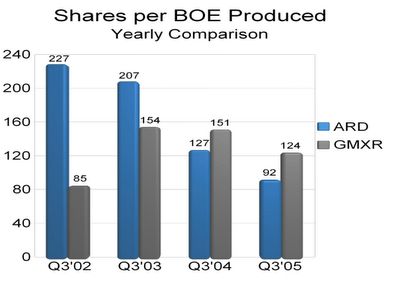
While it is possible to divide total production by the number of shares outstanding to arrive at a number telling me production per share the number would be extremely small and would mean very little to me. To arrive at a figure that is meaningful I instead divided shares outstanding by production to arrive at a figure of shares per BOE produced. Shares per BOE produced simply tells me how many shares of ARD I need to own in order to own one BOE of production. The lower the number of shares per BOE the better. This lower the number of shares per BOE produced means I don't have to own as many shares in order to own that one BOE of production.
The chart below indicates that since Q3'02 shares per BOE produced have been falling at ARD. This is a very good trend. You will also notice that ARD has surpassed GMXR in terms of production performance in the latest measurement period of Q3'05.
(Click on image to enlarge.)
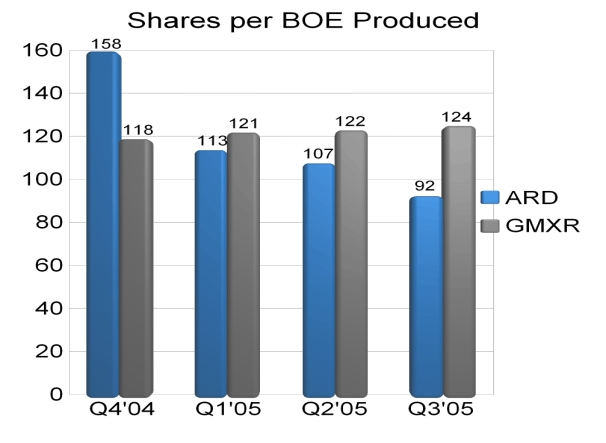
Lets take a look at ARD production performance/valuation for the last 4 quarters as depicted in the chart below.

(Click on image to enlarge.)
Notice in the chart above how ARD shares per BOE produced have been falling each of the last four quarters all the while they have been rising for each of the four quarters at GMXR. Clearly ARD has trends in shares per BOE produced that are excellent. This can not be said for GMXR. In terms of valuation based on production I feel ARD is a better value.
Valuation in Terms of Oil Assets
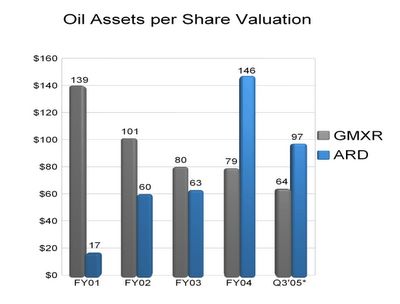
Lets now take a look at oil assets per share. The chart below indicates that over time oil assets per share have been rising at ARD while at the same time declining at GMXR. To be sure, in the Q3'05 oil assets per share at ARD are higher than in the FY2002 period. In contrast, the Q3'05 oil assets per share at GMXR are lower than the FY2002 period.

(Click on image to enlarge.)
In the chart above you will note that oil assets per share have risen at ARD from 0.29 BOE in FY2002 to over 1.62 BOE per share in Q3'05. Based on $60 per BOE the chart below translates the dollar valuation from the above oil assets per share amounts.
(Click on image to enlarge.)
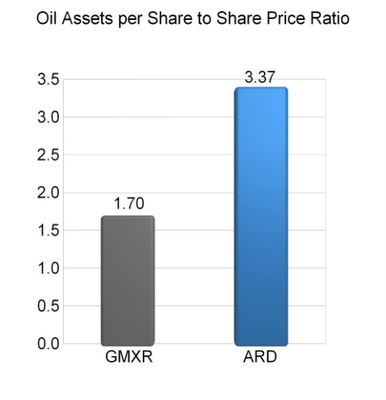
The information in the chart above can be refined even further to find out how ARD is valued based on the ratio between oil assets per share and its recent price.
(Click on image to enlarge.)
The fact that ARD has a ratio of 3.37 means that you would have to take the recent share price of ARD and multiply that share price by 3.37 to arrive at the total value of it's oil assets per share. In other words, ARD shares price would have to more than triple in order to fully value the proved oil assets per share. In contrast GMXR share price would be fully valued with only a 70% share price increase. Clearly ARD provides the investor better possible future returns than GMXR at current prices in terms of oil assets per share.
In conclusion, it is easy to see that ARD is a strong company both fundamentally and operationally and is extremely undervalued in relation to other oil and gas companies. ARD is a superior company to GMXR across the board. Based on fundamentals ARD should be trading at a PREMIUM to GMXR. I have no doubt that ARD valuation in terms of share price will exceed that of GMXR in the near future as investors recognize the superior values and fundamentals. Since GMXR is currently valued higher than ARD in terms of shares per oil produced and oil assets per share ARD has tremendous price appreciation potential in the short term. Long-term ARD price appreciation should be stellar as management continues to amaze investors just as it has since FY2002.
Why ARD Shareholders will be Richly Rewarded
The last few weeks I have taken the time to do something I enjoy. One of the things I enjoy doing is researching companies and digging through SEC filings. I research companies I own as well as prospective companies I might like to own. In the process of my research I have also data mined some companies that I do not own and do not intend to own. The reason for all this research is not just because I enjoy doing it but also because I want to know if my money is well invested. This process involves not only knowing my companies forward and backwards but also being able to compare the companies I"m invested in with other similar companies. This process of comparing companies is often times referred to as benchmarking. Benchmarking not only tells me how my company stacks up against the competition fundamentally but also in terms of valuation. The conclusions that I have drawn from this research is that ARD is a strong company both fundamentally and operationally and is extremely undervalued in relation to other oil and gas companies.
Now the Fun Part...
Now I'd like to make the case for Arena Resources: Ticker Symbol ARD. I'd like to present the evidence that leads me to believe that ARD shareholders will be richly rewarded both short-term and long-term (especially long-term.)
Below you will see how ARD lifting Costs have increased virtually doubling each of the last two years. We are on pace to double the lifting costs again in 2005.

The increased lifting costs in the chart above is a result of increasing oil and gas production. The increased oil and gas production means that the increased costs are spread out over a larger production base. Dividing total oil and gas lifting costs (costs to produce) by total production we get the ARD lifting costs per BOE figures as listed below.

In the chart above please note the decrease in lifting costs per BOE means that the ARD cost structure out at the field is improving below what is already a very low cost structure.
Here is how ARD compares to a company that produces mostly gas. Gas production is well know to have lower cost structures than companies that produce mostly oil. ARD produces mostly oil.
(click on image to enlarge.)
You should note that the difference between the lifting costs of ARD and GMXR have been narrowing. It is great to see that the ARD cost structure is nearly that of a gas producer. This speaks volumes about the tight cost controls at Arena Resources. The driver behind the decrease in lifting costs per BOE is not only a result of tight cost controls but also the explosion in oil and gas production as noted in the chart below.

(click on image to enlarge.)
The increase in oil and gas production in 2005 is on pace to more than double that which was produced in FY2004. The Q3'05 figure in the chart above is for the first nine months of 2005. Production is not only doubling but it has been doing so since FY2002. In other words, this incredible record of production growth has been going on since almost the inception of ARD.
The chart below show just how strong Arena Resources Production is when it is compared to the production history of another popular oil and gas company. The Q3'05 figure in the chart below is for the first nine months of 2005.
%20ARD%20v%20GMXR.jpg)
(Click on image to enlarge.)
GMXR does not have a spectacular production history. In contrast ARD has a spectacular production history.
When we add in depreciation, depletion and amortization (DD&A) along with general and administrative costs (G&A) to the lifting costs noted above we arrive at the total costs in oil production. How high are ARD total costs and how do they compare to GMXR (produces mostly gas)? The chart below is worth a thousand words.
(Click on image to enlarge.)
The fact that ARD produces oil and gas with a cost structure on a per BOE basis that is nearly $12 less than GMXR is nothing short of amazing. The fact that ARD has an impossibly low cost structure means that it also has an impossibly high EBIT per BOE produced. (EBIT means Earnings Before Income Taxes.) How much money before taxes is ARD making? How does it stack up against GMXR? Lets take a look at the chart below.
(Click on image to enlarge.)
The above chart indicates that ARD EBIT per BOE produced is not only increasing rapidly but it has been superior to that of GMXR dating back to FY2002. ARD is a superior company to GMXR in terms of EBIT per BOE produced not only in the latest quarter but also for every period measured dating back to FY2002. If you take EBIT per BOE and production growth into account it is clear that ARD will be EXPLOSIVE in terms of earnings potential. ARD trumps the very popular GMXR not only in terms of EBIT per BOE produced but also in terms of production and production growth. The historical trends and expected future trends favor ARD.
Measuring ARD Valuation
Valuation models allow the measurement of value. Since investors value oil companies based on their production and oil reserves I have two models that I employ. The first uses production as a metric of valuation.
Valuation in Terms of Production
While it is possible to divide total production by the number of shares outstanding to arrive at a number telling me production per share the number would be extremely small and would mean very little to me. To arrive at a figure that is meaningful I instead divided shares outstanding by production to arrive at a figure of shares per BOE produced. Shares per BOE produced simply tells me how many shares of ARD I need to own in order to own one BOE of production. The lower the number of shares per BOE the better. This lower the number of shares per BOE produced means I don't have to own as many shares in order to own that one BOE of production.
The chart below indicates that since Q3'02 shares per BOE produced have been falling at ARD. This is a very good trend. You will also notice that ARD has surpassed GMXR in terms of production performance in the latest measurement period of Q3'05.
.jpg)
(Click on image to enlarge.)
Lets take a look at ARD production performance/valuation for the last 4 quarters as depicted in the chart below.
(Click on image to enlarge.)
Notice in the chart above how ARD shares per BOE produced have been falling each of the last four quarters all the while they have been rising for each of the four quarters at GMXR. Clearly ARD has trends in shares per BOE produced that are excellent. This can not be said for GMXR. In terms of valuation based on production I feel ARD is a better value.
Valuation in Terms of Oil Assets
Lets now take a look at oil assets per share. The chart below indicates that over time oil assets per share have been rising at ARD while at the same time declining at GMXR. To be sure, in the Q3'05 oil assets per share at ARD are higher than in the FY2002 period. In contrast, the Q3'05 oil assets per share at GMXR are lower than the FY2002 period.
%20ARD%20v%20GMXR.jpg)
(Click on image to enlarge.)
In the chart above you will note that oil assets per share have risen at ARD from 0.29 BOE in FY2002 to over 1.62 BOE per share in Q3'05. Based on $60 per BOE the chart below translates the dollar valuation from the above oil assets per share amounts.

(Click on image to enlarge.)
The information in the chart above can be refined even further to find out how ARD is valued based on the ratio between oil assets per share and its recent price.

(Click on image to enlarge.)
The fact that ARD has a ratio of 3.37 means that you would have to take the recent share price of ARD and multiply that share price by 3.37 to arrive at the total value of it's oil assets per share. In other words, ARD shares price would have to more than triple in order to fully value the proved oil assets per share. In contrast GMXR share price would be fully valued with only a 70% share price increase. Clearly ARD provides the investor better possible future returns than GMXR at current prices in terms of oil assets per share.
In conclusion, it is easy to see that ARD is a strong company both fundamentally and operationally and is extremely undervalued in relation to other oil and gas companies. ARD is a superior company to GMXR across the board. Based on fundamentals ARD should be trading at a PREMIUM to GMXR. I have no doubt that ARD valuation in terms of share price will exceed that of GMXR in the near future as investors recognize the superior values and fundamentals. Since GMXR is currently valued higher than ARD in terms of shares per oil produced and oil assets per share ARD has tremendous price appreciation potential in the short term. Long-term ARD price appreciation should be stellar as management continues to amaze investors just as it has since FY2002.
posted by -Aztec- at 11:52 AM
![]()

<< Home