One Company is Fundamentally Superior with a Valuation Significantly Discounted
How can one profit from Peak Oil? The answer is quite simple. Buy shares of a superior oil company that are significantly undervalued. Since oil is the commodity in strong demand and tight supply and not natural gas it would be prudent to consider those companies with the highest percentage of oil proved reserves. Nine companies were found to have the majority of their proved reserves in oil. The percentage of oil proved reserves of these companies range from 56% to 92%. The market caps of these companies range from $36 million to $3.7 billion. It should be noted that GMXR, a company with only 7% oil proved reserves was also included for comparison purposes. The purpose of sifting through the information on these companies is not only to find the best company fundamentally but to use the other 9 companies as a benchmark to determine if the superior company shares are selling at a discount to their fair value. Analysis of the company fundamentals included such important performance metrics as cost structure, earnings power, EBIT margin per BOE ownership, production growth, hedging, long term debt and exploration and development capex as a function of production. If the company with superior fundamentals is selling at a significant discount to fair value then enterprising investors should consider the shares for purchase after a "full background check." One such company is not only found to be fundamentally superior to the rest but also sells at a significant discount to fair market value. This company is none other than Arena Resources (ARD.)
Searching for Companies Concentrated in Oil
The investigation began by digging through countless SEC filings in order to determine which companies have the highest percentage of oil proved reserves. This was somewhat tedious as only 9 companies were found to have proved reserves of over 50% oil. Keep in mind that GMX Resources was included for comparison purposes even though it only has proved reserves of 7% oil. Companies were only considered if they were traded on NYSE, NASDAQ or the AMEX with market caps between $30 million and $4 billion. Companies with significant foreign operations were not considered.
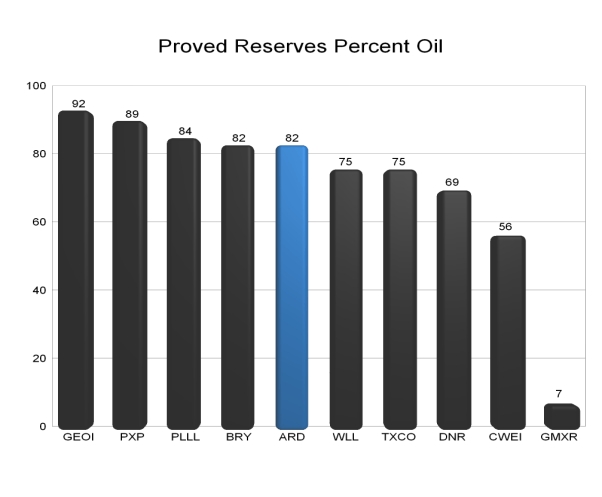
The 10 companies meeting our criteria with the associated percentage of oil proved reserves are as follows:
1. GeoResources (GEOI) ________________92%
2. Plains Exploration & Production (PXP) ____ 89%
3. Parallel Petroleum (PLLL)_____________ 84%
4. Berry Petroleum (BRY)_______________ 82%
5. Arena Resources (ARD)_______________ 82%
6. Whiting Petroleum (WLL) _____________ 75%
7. Exploration Co. of Delaware (TXCO)_______ 75%
8. Denbury Resources (DNR) _____________ 69%
9. Clayton Williams Energy (CWEI)_________ 56%
10. GMX Resources (GMXR)_______________ 7%
(Click on image to enlarge)
Determining Cost Structure
One of the most important considerations of a company fundamentally is the cost structure. The lower the cost to produce a product the better. It doesn't matter what industry you talk about, the low cost producer always rises to the top and has an advantage over the competitors. Southwest Airlines and Walmart come to mind as two prominent low cost producers. They also happen to be the most successful companies in their industry. Shareholders have certainly been richly rewarded over time. Lower costs mean higher earnings. Higher earnings yields a higher share price.
An effective method of determining cost structure of an oil company is finding the cost per BOE produced. To determine cost per BOE produced simply divided total expenses on the income statement by total production in BOE.
The SEC mandates that oil companies use one of two methods in determining their expenses. The methods are either the full cost method of accounting or the successful efforts method of accounting. Its seems most companies use the full cost method of accounting. One big difference between the two methods is that the "Successful Efforts" method of accounting expense such items as exploration costs and dry holes. Such items as exploration costs and dry holes are not expensed under the full cost method of accounting. They are instead capitalized and are therefore not included as an expense on the income statement.
To keep our cost structure analysis meaningful, those companies utilizing the successful efforts method of accounting had certain items expensed on the income statement removed for our calculations. This effectively reduced expenses and increased EBIT for these companies. If this step was not taken it would be impossible to make meaningful comparisons. This analysis effectively converts those companies using the successful efforts method of accounting to that of the full cost method thereby allowing comparisons using one method of accounting.
We will begin our analysis of the 10 companies by reviewing the cost structure of each company in the FY 2003. You will note that the average of the 10 companies is included in red. The results of our superior company, Arena Resources, is displayed in blue.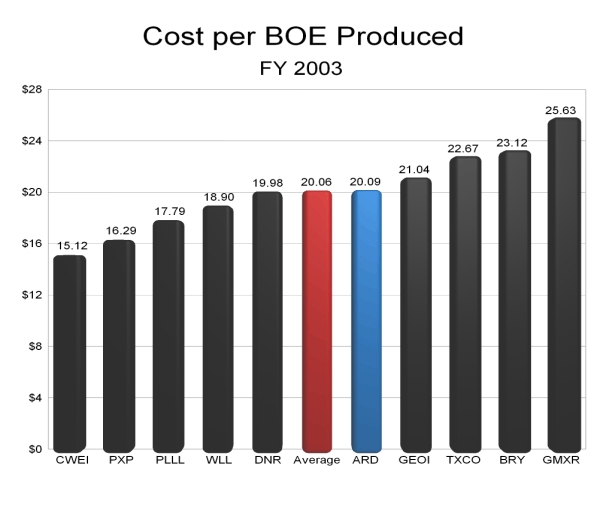
Figure 1 (click on image to enlarge)
In the above slide you will note that ARD had a cost structure that was nearly identical to the average cost structure. As we transition from 2003 to 2004 the changes in cost structure for each company are charted below.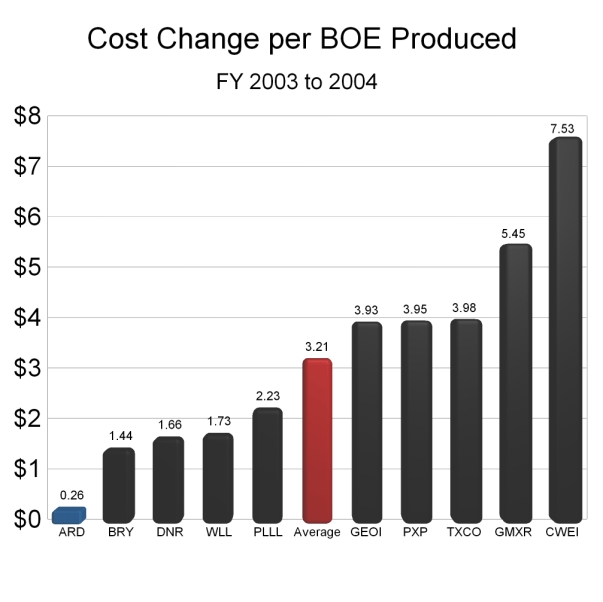
Figure 2 (Click on image to enlarge)
In Figure 2 the average rise in cost per BOE produced was $3.21. ARD had the smallest rise in cost per BOE produced. Such a small rise between the years 2003 and 2004 allowed ARD to have a cost structure significantly lower than the average as noted in Figure 3.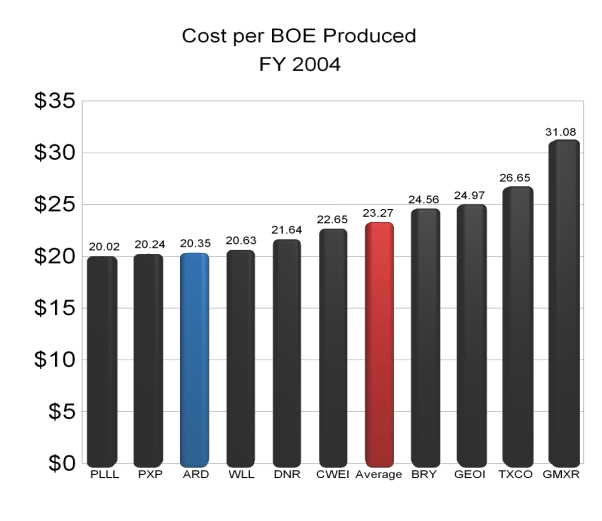
Figure 3 (Click on image to enlarge)
Below, in Figure 4 the average rise in cost per BOE produced was $4.04. ARD had a $0.64 decline in cost per BOE produced between 2004 and 2005.
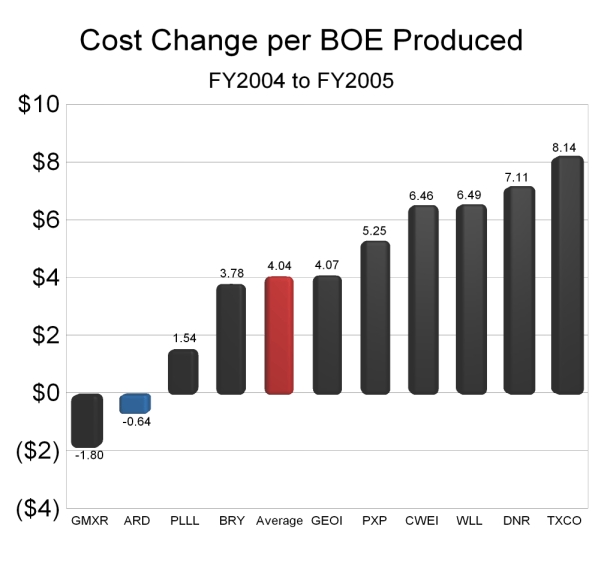
Figure 4 (Click on image to enlarge)
The superior cost controls between 2004 and 2005 allowed ARD to move into first place as the low cost producer in 2005 as noted in figure 5 below. This is significantly lower than the average cost per BOE produced. The ARD cost structure is $7.60 lower than the average cost structure to be exact.
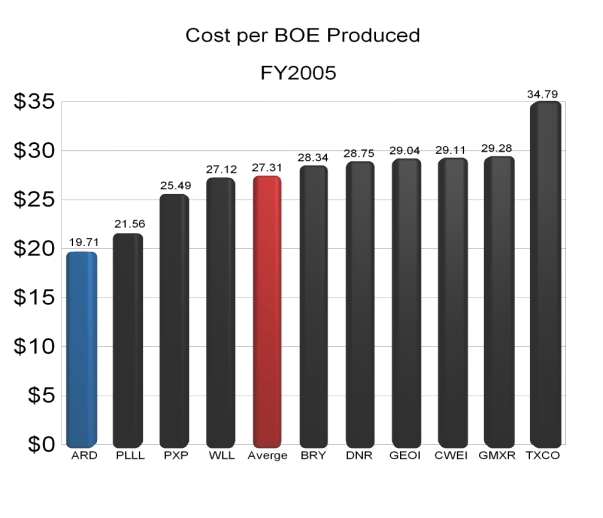
Figure 5 (Click on image to enlarge)
If we look at Figure 6 below it is noted that ARD was the only company to reduce its cost between the years 2003 and 2005. The other nine companies saw a rise in cost per BOE produced between these two years. The average rise in cost per BOE produced was $7.25. ARD certainly exhibited superior cost controls in order to show a decline of $0.38 per BOE produced while the average cost change for everyone else was $7.63 higher than that of ARD. Even the gap in performance between ARD and the company with the second best record is significant. ARD truly is the low cost king of oil production. This is especially true given the fact that the other companies were unable to fend off rising costs per BOE produced. Certainly ARD has a significant advantage over its peers in terms of cost structure.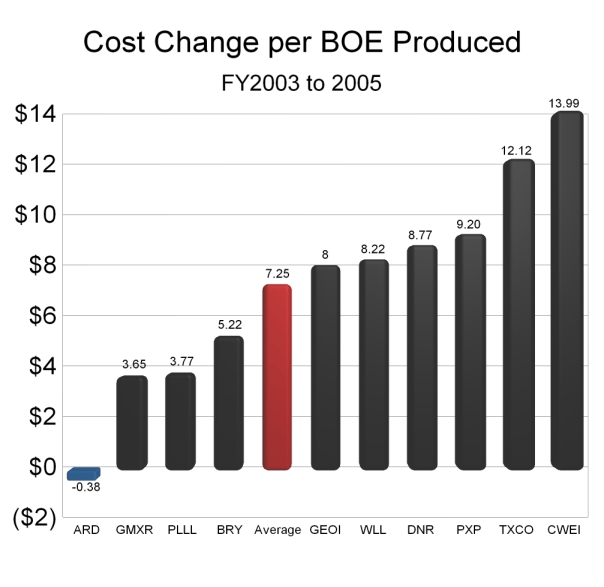
Figure 6 (Click on image to enlarge)
Determining Earnings Power
Earnings power in this analysis is determined by each oil companies EBIT per BOE produced. To determine this amount simply divide EBIT (earnings before income taxes) by the total BOE produced. Those companies using the successful efforts method of accounting actually had their EBIT amounts increased by these calculations due to expenses being decreased as described earlier. The efficiency of an oil company to produce the highest amount of EBIT for every BOE produced is important. The higher the amount of EBIT per BOE the more efficient is the operation. The company with the superior EBIT per BOE produced not only provides the greatest earnings potential but also increases the effective value of the proved reserves resting underground.
FY2003 EBIT per BOE Produced is displayed in figure 7 below. The average EBIT is $7.01. ARD has an EBIT of $8.41.
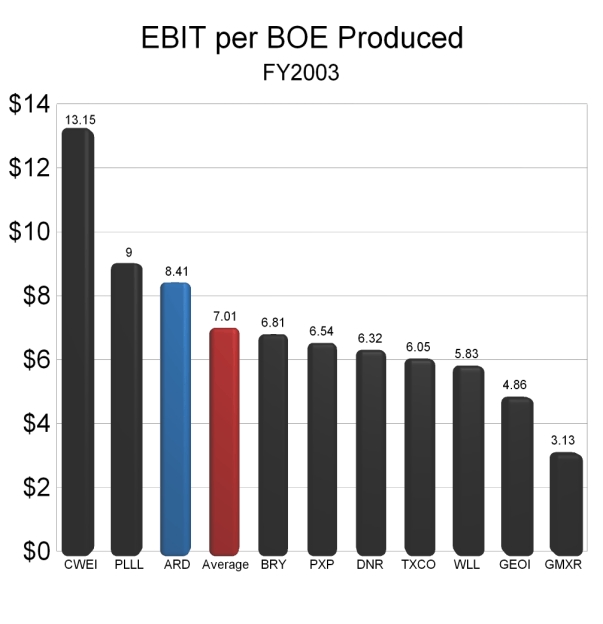
Figure 7 (Click on image to enlarge)
In the slide below it should be noted that ARD had the greatest increase in EBIT change per BOE produced between 2003 and 2004 at $8.82. The average increase between these years was only $2.39. See figure 8.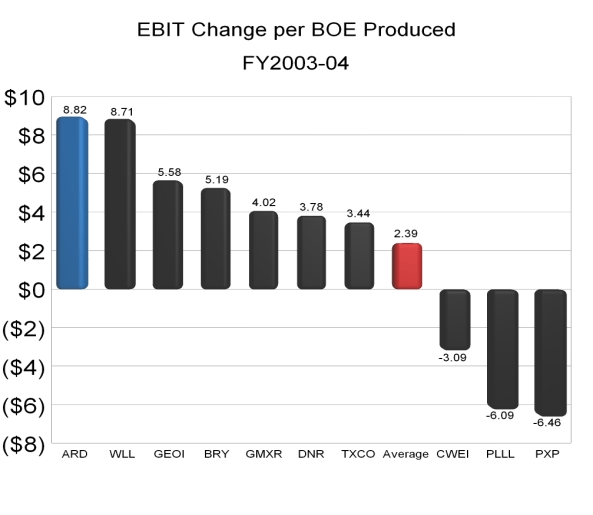
Figure 8 (click on image to enlarge)
In 2004 ARD had the highest EBIT per BOE produced coming in with $17.23 as noted below in figure 9. The average EBIT per BOE produced was only $9.40 in this year. ARD had nearly a $3 advantage over the second best EBIT per BOE produced performer and nearly an $8 advantage over the average.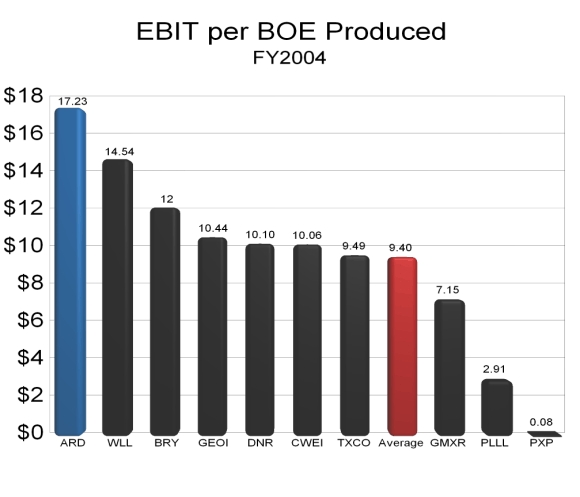
Figure 9 (Click on image to enlarge)
Between 2004 and 2005 ARD had an above average increase in the EBIT per BOE produced as noted in figure 10 below. ARD increased EBIT per BOE produced by $12.44 between these years while the average only rose by $5.49 during the same time period.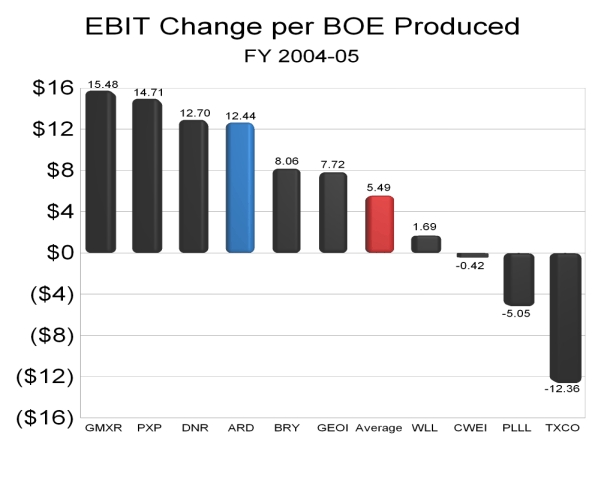
Figure 10 (Click on image to enlarge)
In figure 11 below note how ARD EBIT per BOE produced is now $29.67. This has now grown to nearly $7 higher than the second best EBIT per BOE produced performer and nearly $18 above the average.
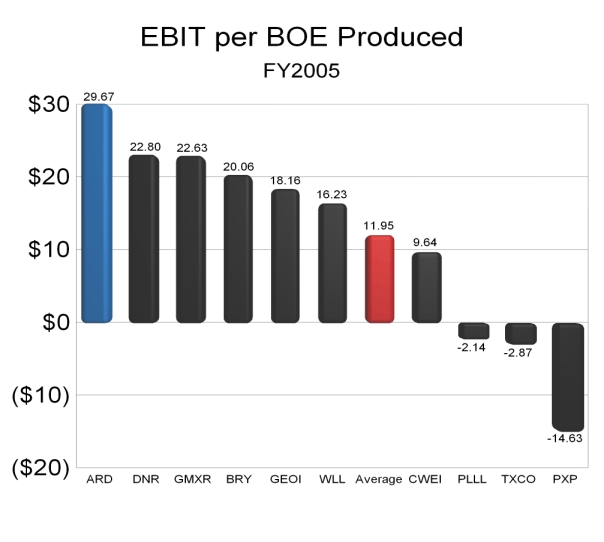
Figure 11 (Click on image to enlarge)
Between the years 2003 and 2005 ARD had the greatest increase in EBIT per BOE produced. During this time period ARD increased EBIT per BOE produced by $21.26. This compares to the average increase of $4.95 as noted in figure 12.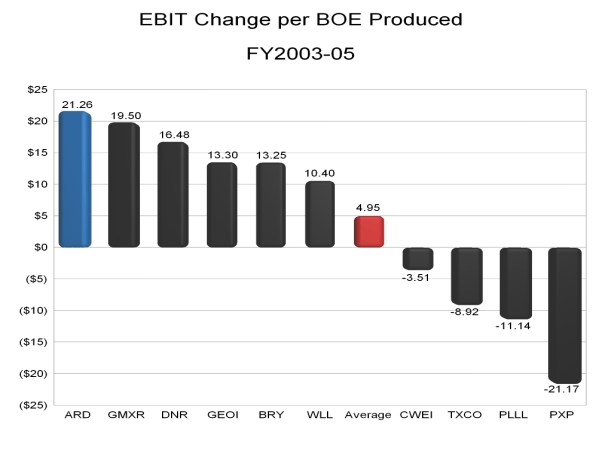
Figure 12 (Click on image to enlarge)
Clearly ARD is superior in terms of EBIT per BOE produced. ARD displayed the highest EBIT per BOE produced in 2004 and 2005. ARD also proved that between the years 2003 and 2005 it was able to increase EBIT per BOE produced more so than any of its peers. Without a doubt, ARD has a significant advantage over its peers in terms of converting each BOE produced into the highest amount of EBIT.
Owning Proved Reserves Via Share Ownership
One way to gauge the value of the shares of an oil company is to determine how much money you have to spend in order to "own" one BOE of proved reserves. Certainly the lower the "cost" to own one BOE the better. Determining the cost to own one BOE is easy. Simply divide the current share price by the number of BOE per share.
For example, ARD has 30.19 million BOE of proved reserves. ARD has
13,226,702 shares outstanding according to the cover page on the 2005 10K. The first step is dividing the amount of BOE by the number of shares to arrive at oil per share. The math is as follows:
30.19 million BOE / 13,226,702 shares = 2.28 BOE per Share.
Now simply divide the current share price $35.80 by the amount of oil per share. The math looks like this:
$35.80 / 2.28 BOE = $15.70
This means that you would have to spend $15.70 to "own" one BOE of oil proved reserves. The next step to determine what you would receive if your BOE was sold. The latest year with data available is 2005. In 2005 ARD had EBIT of $29.67 per BOE produced. In other words, your BOE if it was sold would put $29.67 in your pocket. Since you only had to spend $15.70 to buy that BOE you will profit by the amount of $13.97
Math is as follows:
$29.67 (your EBIT per BOE) - $15.70 (your cost per BOE) = $13.97.
What kind of EBIT margin did you achieve on the transaction? To figure this amount simply divide $13.97 (the amount in EBIT you "earned") by $15.70 (the amount you had to pay for "ownership" of the BOE.) The result is 88.9%
What does 88.9% mean to you as an investor? It means that if you purchased the exact amount of shares or fractions thereof in order to own one BOE of proved reserves you could turn around and sell your BOE and have earnings before income tax (EBIT) that is 88.9% higher than what you paid. That is an excellent return on investment. By computing this amount we are taking into account many different factors that include share price, proved BOE per share, EBIT per BOE and shares outstanding. The results are as follows in figure 13 below. Clearly ARD is second best of the 10 companies when measuring value in terms of EBIT margin per proved BOE ownership. Long term debt was not factored in the results below.
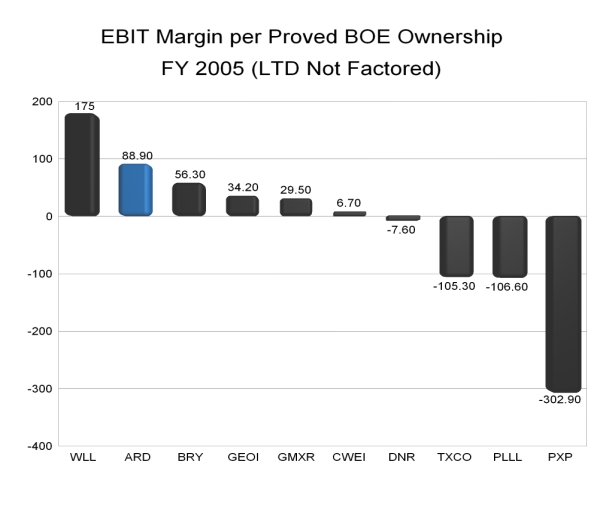
Figure 13 (Click on image to enlarge)
Certainly companies can borrow millions from their credit facility in order to purchase oil fields with proved reserves. A company could go into debt in order to make their proved reserves per share look large. Another company might chose to remain debt free and have a smaller proved reserve per share amount. To compensate for this long term debt must be "factored out." In other words we take the amount of debt and divide by the number of shares outstanding. This amount is added to the current share price. The debt has the effect of increasing the cost of share ownership and hence an increase in the cost to own one BOE of proved reserves.
Below in figure 14 it is revealed that if we factor in the debt ARD is actually the leader in EBIT margin per proved BOE ownership. WLL had a significant drop in margin from 175% to 75% as a result of $875 million in longterm debt. ARD is virtually debt free and had a drop in EBIT margin per proved BOE ownership from 88.9% to 88.8%. ARD has only a $400,000 that it owes to Tim and Stan ( CEO and Chairman of ARD.)
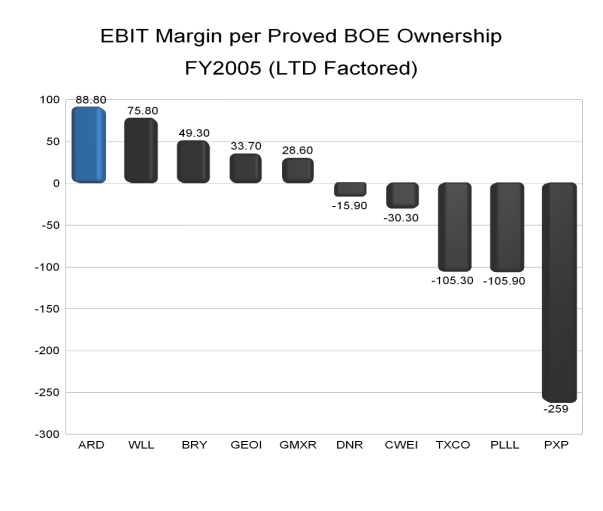
Figure 14 (Click on image to enlarge)
Does ARD have a weakness? At first glance it may appear that the capitalized costs per BOE produced are excessive. However, after examining the peer group it is evident that those companies with the higher percentage of developed proved reserves also had lower exploration and development capitalized costs per BOE produced. Since ARD has a very high percentage of undeveloped proved reserves it is not alarming to see a higher exploration and development capitalized cost per BOE produced. GMXR and GEOI are perfect examples of why this is true. Since ARD is spending money to ramp up production and is working with a relatively small production base it is not worrisome to see these figures. Over time expect ARD to post a higher percentage of developed proved reserves and a lower exploration and development capitalized cost per BOE produced.
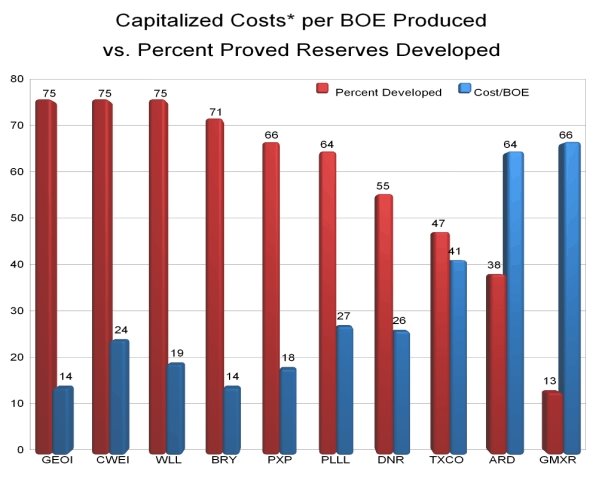
Figure 15 (Click on image to enlarge)
In conclusion, it is easy to see that ARD is the superior franchise. ARD is the low cost producer. ARD also has the highest EBIT per BOE produced. It is ironic that ARD, being the superior franchise, is selling at a discount to every company in the peer group. The very fact that ARD has the highest EBIT margin per BOE ownership indicates that ARD shares offer the most compelling value in terms of share price, BOE per share, EBIT per BOE produced and long term debt. At first glance it seems ARD has an Achilles heal in terms of the exploration and development capitalized costs per BOE produced. However a look at the peer group indicates that this is normal and we should expect these costs to decline over time. ARD does not hedge and has virtually no debt. Most in the peer group have vast amounts of long term debt and many of these companies are forced to hedge and will be limiting their total returns when oil prices spike higher this summer. ARD is increasing production every quarter. ARD will be increasing the rig count from one to three this quarter. Tripling the rig count will no doubt boost production results and ultimately earnings and cashflow. Many companies in the peer group have production that is flat to lower. As more investors learn of the ARD story expect the shares to appreciate significantly as earnings continue to grow and the PE multiple expands.
"ARD is the Biggest Little Oil and Gas Company on the Planet."
posted by -Aztec- at 4:57 PM
![]()

<< Home