Why this Company is Worth it's Weight in Gold
Arena Resources oil production will simply be amazing in 2006. There really is no other way to describe it. ARD has already amazed us with its impossibly low cost structure and the corresponding unbelievably high EBIT per BOE produced. When we closely examine the production estimates for not only Q4 2005 but also FY2006 we should get a clear picture of why this stock is poised to march much higher from the current levels of $29 per share.
Q4 Production
The production models that I came up with involve first determining the number of oil wells that have been drilled in each quarter beginning with the 2005 drilling program. The number of oil wells that have been completed and producing in each quarter are indicated in the respective quarterly operational update. How do I know how many wells will be drilled in Q4? In a December 8, 2005 press release it was stated, "Management initiated development work on the Fuhrman-Mascho in mid April, 2005 with one contract drilling rig and projects it will drill and complete 35 development wells and re-frac 20 existing wells by year end 2005."
I simply subtract the number of wells that have been completed to date from the total number of wells to be drilled and completed in 2005.
The chart below will illustrate the number of wells that have been completed and producing in each successive quarter.
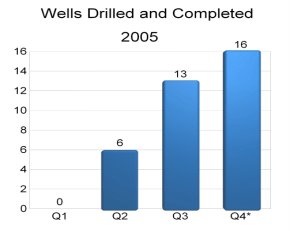
(Click on image to enlarge)
The number of wells to be drilled in Q4 is an estimate based on the stated objectives in the above press release.
Understanding Well-Weeks
The next step is to determine how much production potential has been created in Q4 as a result of having drilled 16 wells. Each well that has been completed and producing for 1 week generates one well-week (W.W. for short.) For example if one well has been producing oil for five weeks it has produced five W.W. One more example would be if three wells have been producing for 10 weeks the resultant number of W.W. would be 30.
How many W.W. were created in Q4 2005? Since there were 16 wells estimated to have been drilled simply divide 16 by 13 (the number of weeks in Q4.)
16/13 = 1.23 wells drilled each week.
How many well weeks total?
________Wells Drilled____Weekly Total____Quarterly Total
Week 1........1.23.............1.23...............1.23
Week 2........1.23.............2.46.............3.69
Week 3.........1.23.............3.69..............7.38
Week 4.........1.23.............4.92............12.3
Week 5.........1.23............6.15.............18.45
Week 6..........1.23...........7.38............25.83
Week 7..........1.23............8.61............34.44
Week 8..........1.23............9.84............44.28
Week 9..........1.23...........11.07...........55.35
Week10.........1.23...........12.30............67.65
Week11........1.23.............13.53............81.18
Week12.........1.23.............14.76.........95.94
Week13.........1.23.............15.99........111.93
The weekly total is the number of well-weeks generated each week. The quarterly total is the cumulative number of well weeks generated. At the end of the quarter you will notice that 111.93 well-weeks will have been created.
Now the next step is to put a value on each well-week.
In 2005 Q3 production increased 31,367 Bbl (from Q2 oil production total of 92,233 to Q3 total of 123,600.) It should also be noted that Q3 had 169 well-weeks.
If we divide the increase of 31,367 Bbl Oil in Q3 by the number of well-weeks we get:
31,367 / 169 = 185.6
Lets round that quotient down to 185 for simplicity. This number simply means that each well produced 185 Bbl per week. (Keep in mind that this is an estimate and assumes that gains from refracs are added in as well as natural declines in production.)
We have determined that Q4 will alone create 112 (rounded from 111.93) well weeks as determined from above. However we must also add in the number of well-weeks from Q2 and also from Q3. Please note that although the number of well-weeks created in Q4 2005 was 112 when we add in Q4 well-weeks for figuring Q1 2006 the 112 w.w. effectively increases to 208.
How does the number of well-weeks corresponding with Q4'05 magically increase from being 112 in Q4'05 to 208 well-weeks in Q1'06?
The total number of wells in Q4'05 (16) are all pumping oil for every week in Q1'06. Since there are 13 weeks in each quarter the math is as follows:
16 x 13 = 208.
Please keep in mind that this is part of the process in determining the total number of well-weeks for each quarter in the chart below.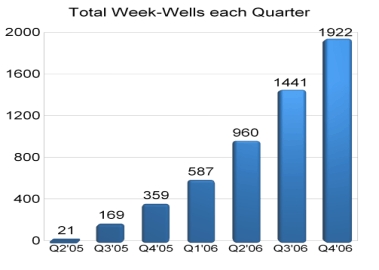
(Click on image to enlarge)
Now that we have determined the number of well-weeks in each quarter and have determined from above that each well-week is initially valued at 185 Bbl we can figure out the quarterly production.
Natural Production Declines
As it is natural for oil production to decline over time we must also add in the natural production declines to get the most reliable oil production totals. There was only a 2% annual decline rate for Q4'05 as I feel refracs would compensate for any additional declines. However beginning with Q1 2006 I have included natural decline rates as follows:
Annual Decline Rates*
Q1 2006____(-6.4 %)
Q2 2006____(-6.6 %)
Q3 2006____(-8.9 %)
Q4 2006____(-9.1 %)
*Quarterly rate x 4 = annual decline rate.
In order to factor in the above projected natural decline rates the estimated amount of production per Well-Week is reduced. The Production per Well-Week figures are as follows:
Q3 2005_____185 (Base quarter.)
Q4 2005_____184 (-2 %)
Q1 2006_____181 (-6.5 %)
Q2 2006_____178 (-6.6 %)
Q3 2006_____174 (-8.9 %)
Q4 2006_____170 (-9.1 %)
The above decline rates are conservative as I feel the above decline rates overstate the actual declines. I would rather have my quarterly oil production figures error on being too conservative (small) than too aggressive (large.)
Please also note that the oil production figures below do not yet include any natural gas production. 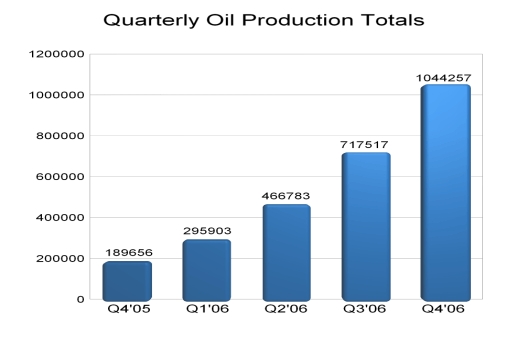
(Click on image to enlarge)
The above chart indicates total oil production for each quarter only. We must still add in the gas production totals.
Gas Production
Based on my analysis of gas production by state and the associated trends I am calling for Q4 2005 gas production in terms of Mcf as follows:
TX: 62,000
NM: 42,000
OK: 10,000
KS: 35,000
Total: 149,000 Mcf or 24,833 BOE
With Q4 2005 oil production of 189,656 BOE and gas production of 24,833 BOE we should achieve a total Q4 2005 figure of 214,489 BOE.
189,656 + 24,833 = 214,489
Based on $54 realized price per BOE we will achieve a total revenue figure of $11,582,406 in Q4 2005
214,489 x $54 = $11,582,406
Based on a Net Profit Margin of 49% I forecast Net Income of $5,675,378
$11,582,406 x 0.49 = $5,675,378
Based on a share count of 13.4 million shares the fully diluted EPS (Earnings per Share) should be $0.42 for Q4 2005.
$5,675,378 / 13,400,000 shares = $0.42
Q4 2005 Forecast Summary:
Total Oil and Gas Production: 214,489 BOE
Revenue: $11,582,406
Net Profit Margin: 49%
Net Income: $5,675,378
Shares Outstanding: 13.4 Million
Q4 2005 EPS: $0.42
In conclusion, it is easy to see that Arena Resources is not only an oil and gas company but also a goldmine.
posted by -Aztec- at 6:08 AM
![]()

<< Home