ARD Price Target FY07: TBA
ARD EPS Estimate FY07: TBA

Monday, September 25, 2006

Why an Economic Slowdown in the USA Would Have Little Impact on World Oil Demand
North American Incremental Oil Demand Accounted for only 8% of Total Between 2004 and 2005.


Between 2004 and 2005 world oil demand increased by 1.11 million barrels per day according to the International Energy Agency Oil Market Report dated July 2006. Of this incremental increase of 1.11 MMB/d demand in North America (USA and Canada) increased only 90,000 b/d as depicted in chart 1 below. In terms of percent this amount to just over 8% of the incremental world oil demand between 2004 and 2005 as depicted in chart 2 below.
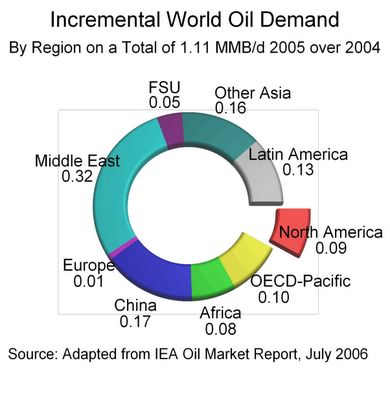

Chart 1. (Click on Image to Enlarge)

Notice how the Middle East accounted for over 28% of the world incremental oil demand. This is nearly twice as much new demand as that of China between 2004 and 2005. With the new found oil wealth from rising oil prices the countries in the Middle East have vast amounts of money to spend on their economies. There is no doubt that the increase in GPD causes an increase in oil consumption. If you plot total Middle East GPD against total Middle East oil consumption you will see a line that increases against each axis. For more information on this phenomenon read chapter 4 of Peter Tertzakian's book, " A Thousand Barrels a Second."
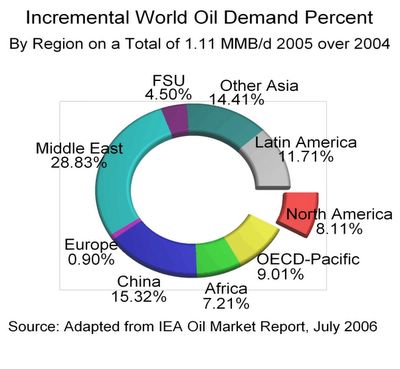

Chart 2. (Click on Image to Enlarge)

In conclusion, those Wall Street analysts with Harvard MBAs who are worried about a US economic slowdown causing a significant drop in year over year world oil demand will be surprised to find that such an occurrence will have very little affect on world incremental oil demand. Even if growth does slow one can still expect year over year U.S. oil consumption to increase in 2006 and 2007. Now is not a good time to sell quality oil company shares like ARD.

Saturday, September 23, 2006

The End of High Oil Prices and Peak Oil?
Should Investors Sell ARD Shares Based on Decline in Oil Prices?

Volatility in Oil is Normal

This is the shoulder season....for starters. What this means is that the need for oil products is at a seasonal low due to lack of heating and cooling requirements.

The worldwide oil supply and demand the picture is very bullish. Nothing has changed.

Note how Q2'06 supply is less than Q2'05 supply. In fact it is 500kpbd less. Now look at demand. Demand in the most recent quarter in which data is available (Q1'06) is higher than year ago numbers. It is 900kbpd higher.

Now look at this chart:


(Click on Image to Enlarge)


Last year in 2005 we hit about $69 in mid August. The first week of November we hit about $57. This represents a $12 drop or 17%.

Fast forward one year to 2006 and we hit a high in mid August of $78. We are one week from October and at $60. This represents a $18 drop or 23%. This decline has lasted 6 weeks so far.

If we go back to 2004 we see that there was a major sell off in oil prices between October and December of that year. In October 2004 oil hit a new high of about $55. It sold off after making that new high to about $41 in December of 2004. This represented a $14 sell off or 25%. This sell off lasted about 6 weeks.

Percentage wise we may drop another couple percent to hit a $20 drop (25% decline) from our high of $78...maybe close at $58-59 for a day or two followed by a final goodbye to the $50s before oil goes above $60. OPEC may be a driver of pushing oil back above $60 by either announcing a cut or even the mere WORRY of an OPEC oil cut. You can bet that the oil bears will begin to become fearful with their short positions when oil goes below $60.

As far as duration goes we have been in this bearish funk for 6 weeks now. While the sell off in oil lasted longer in 2005 (17% drop) the sell off in 2004 was more pronounced (25%) but the decline was shorter lived (6 weeks.)

ARD Volatility is Normal

ARD has seen two drops in share price in the last year previous to the current decline. On January 23, 2006 ARD closed at a high of $36.47. Six weeks later it closed at a low of $26.33. The represents a 27.8% decline. Keep in mind that the duration of the decline was 6 weeks.

The second occasion in which ARD shares declined had the peak on May 10, 2006 when the shares closed at $36.20. Five weeks later the shares hit bottom on June 13, 2006 when they closed at $26.36. This represented a 27.1% decline. Again the duration was 5 weeks.


Most recently ARD hit a high of $40.64 when it closed on August 26, 2006. Yesterday ARD closed at a low of $30.61. This is a decline of 24.6% in a period of 4 weeks. Given the fact that the most recent decline has been more dramatic one should expect the duration to be shorter lived.

In conclusion, based on duration as well as percentage decline I think we are extremely close to a bottom. Contrary to what some have said we have NOT broken a multi-year upward trend. The worldwide supply demand issues have not changed. The decline in ARD shares is nothing new. Volatility is normal. Don't be fooled into thinking that peak oil, high oil prices and prospects for success at Arena Resources Inc. are over. This is just the beginning.

Friday, September 22, 2006

ARD Limit Order Filled @ $32.02

I'm putting my money where my mouth is.

Thursday, September 21, 2006

ARD Production Concentrated in Oil
Production Profile Provides Limited Downside Risk with Significant Upside Potential in Current Oil and Gas Pricing Environment


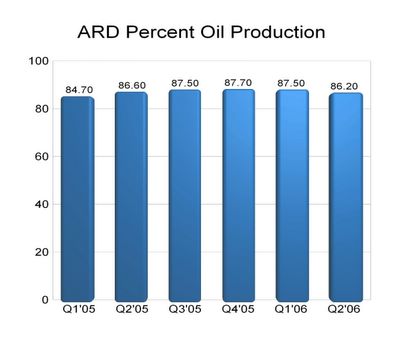
In the latest quarter ARD had 86.2% of its production in crude oil as depicted in the chart below. This is one of the highest oil production percentages in any domestic E&P. Given this fact ARD is insulated to a large degree from the declines in natural gas.


(Click on Image to Enlarge)

Oil prices have fallen about 21% from their highs in the $78 range to the current $61. Even with the significant drop in oil prices ARD is generating tremendous amounts of cash in the current pricing environment. Part of this is due to the low cost structure of ARD. The other primary factor is the high oil production percentages of total production as depicted in the chart above.

Where Do Commodity Prices Go From Here?

There is no shortage in natural gas in North America or worldwide. In fact when Saudi Oil fields go into steep decline they will switch from being major producers of crude oil to major producers of natural gas. Liquid Natural Gas will keep the USA well supplied in the coming years. Certainly there could be a rise in Ng prices if the Gulf of Mexico is hit with multiple hurricanes.

Given the fact that there is limited spare capacity with crude oil, demand worldwide is increasing and supplies are becoming increasingly more difficult to maintain let alone increase to meet the rising demand. One should expect Saudi Arabia and OPEC to defend the price of oil at $60. With that said we are near a bottom in terms of oil prices. In addition many commodity traders and investors feel that the decline in oil is due in part to government shenanigans related to the upcoming elections in November (release of oil from SPR, timing of news release regarding oil find at over 27,000' in Gulf of Mexico, and any other possible government involvement in commodity trading that is "under the table.") Many investors have stated their intentions to buy back into oil as we near the U.S. elections. In any case we have two lines in the sand regarding oil. The first is the $60 line as dictated by OPEC. The second is the anticipation of rising oil prices after the US elections that occur on November 7, 2006.

In conclusion, ARD investors should expect limited downside risk and significant upside potential from current prices based on the ARD production profile of over 86% oil in the most recent quarter.


U.S. Oil Addiction Index & Peak Oil Meter
For the Week of September 15, 2006

U.S. Crude Production: 5,109,000 bpd
Increase from Year Ago: 609,000 bpd
Percent Increase: 13.5%

Gasoline Demand: 9,229,000 bpd
Increase from Year Ago: 410,000 bpd
Percent Increase: 4.6%

U.S. Average Retail Regular Gasoline Price: $2.49
Decrease from Year Ago: 10.4%


Figures for Year Ago Weekly Amounts:
U.S. Crude Production: 4,500,000 bpd
Gasoline Demand: 8,819,000 bpd
U.S. Average Retail Regualar Gasoline Price: $2.78

Saturday, September 16, 2006

Arena Resources #30 on IBD 100 List
Report in September 18th Edition; Coverage Begins on Page 1B

Thursday, September 14, 2006

GEOI Merger: An Example of How Not to Operate an Oil and Gas Company
Acquisition is Costly to Current GEOI Shareholders

The merger announced today is a bad deal for current GEOI shareholders.

Here's why:

Prior to merger GEOI had about 3.767 million shares outstanding with proved reserves of 2.812 million bbls oil and 232K BOE gas.

Valuation is as follows:
$60 (per Bbl oil) X 2.812 million bbls oil = $168.72 million
$36(per BOE gas*) X 232 thousand BOE gas = $8.352 million

*(6Mcfe = 1 BOE)

Total value of GEOI proved reserves prior to merger = $177.0 million.
Total shares outstanding prior to merger = 3.767 million shares
Value per share proved reserves = $47.00

............Post Merger....................
8.1 million BOE proved reserves. (Lets assume that every BOE is oil.)

8.1 million X $60 = $486 million in value.

Total shares outstanding =3.767mm (pre-merger) + 8,263mm (Southern Bay) + 1,931mm (Chandler) = 13.961 mm shares outstanding.

$486 million (value proved reserves)/ 13.961 million shares = $34.81

Value per share proved reserves = $34.81

What can we conclude?

GEOI shareholders have lost 25% of their proved reserves asset value ($47 to $34.81) overnight. GEOI Shares should be selling off sharply instead of rising. Investors are too quick to associate the word "acquisition" to the phrase,"good for shareholders." This is an acquisition that dilutes proved reserves per share. In other words, the underlying asset value per share has decreased sharply overnight. One should also keep in mind that the figures in the above computation assumed the best case scenario for current GEOI shareholders in that all 8.1 million BOE were 'assumed' to be oil. We all know that is most certainly not the case.

Expect GEOI shares to decline in value to the $4 to $5 range based on a reduction in proved reserves asset value of over 25%.

Wednesday, September 13, 2006

U.S. Oil Addiction Index & Peak Oil Meter
For the Week of September 8, 2006

U.S. Crude Production: 5,076,000 bpd
Increase from Year Ago: 808,000 bpd
Percent Increase: 18.9%

Gasoline Demand: 9,368,000 bpd
Increase from Year Ago: 732,000 bpd
Percent Increase: 8.4%

U.S. Average Retail Regular Gasoline Price: $2.61
Decrease from Year Ago: 11.5%


Figures for Year Ago Weekly Amounts:
U.S. Crude Production: 4,268,000 bpd
Gasoline Demand: 8,636,000 bpd
U.S. Average Retail Regualar Gasoline Price: $2.95

Monday, September 11, 2006

ARD Shares Capitulate on Fear
Arena Resources and the Shareholders are Presented with Opportunity

Yesterday ARD shares closed significantly lower based on fears of Iran cooperation with the west and lower oil prices in the future. From a macro standpoint of oil one should disconnect from the market fears based on the fact that the fundamentals for rising oil prices longterm are in place. Read the books, "Twilight in the Desert" and "A Thousand Barrels a Second" for more guidance on this topic.

Based on a company perspective there is no better oil investment on any exchange that has stronger fundamentals and growth prospects in terms of oil production, revenues, net income and EPS than Arena Resources, Inc. In terms of growth ARD will eclipse the competition and continue to impress. ARD also has the luxury of over 86% in oil production and 82% proved reserves oil. The point is that even if ARD realizes $57 oil per BOE this is significantly higher than those oil and gas companies with a majority of their production in NG. A BOE of NG is currently worth less than $36 based on $6 per Mcfe (6Mcfe = 1 BOE.)

One should not be at all concerned about the recent drop in oil prices. The longterm worldwide supply demand issues remain in place. This fact must be underscored. The decline in ARD share price is an excellent opportunity for those looking to initiate a position or expand their position in ARD shares. Share ownership means you have an ownership in the business. The drop in share price is a good thing in this context. The more irrational Mr. Market the greater the potential profits that can be realized. Mr. Market is currently manic depressive. The current price is very attractive. The lower the price the more attractive the shares become.

The other attractive feature of the current oil selloff is the fact that ARD has enhanced opportunities to make an acquisition at a price that is reasonable. The bargaining power is with the buyer instead of the seller in times like this.

In conclusion, investors in ARD need to view the decline in oil as a positive. The more irrational Mr.Market the greater the potential for reward for both Arena Resources and the shareholders.

Saturday, September 09, 2006

ARD Down 12.3% from 52 Week High
Superior Fundamentals are Intact; Volatility Normal

Worldwide oil supply-demand issues remain in place. China, India and rest of the world continue to exhibit growth in thirst for petroleum. Problems with Saudi Oil fields as well as declines in some of the worlds largest oil fields have not disappeared. Oil sell off is normal as we enter the "shoulder season" (Demand for heating and cooling is minimized between the summer and winter months.) If oil declines further expect OPEC to defend price at $60. The words of Matthew Simmons, Peter Tertzakian, Boone Pickens and Stephen Leeb should be underscored. The fundamentals of Peak Oil remain in place. Just remember that the cure for low oil prices is nothing other than low oil prices.
Arena Resources #4 on IBD 100 List
Report in September 11th Edition; Coverage Begins on Page 1B

Thursday, September 07, 2006

U.S. Oil Addiction Index & Peak Oil Meter
For the Week of September 1, 2006

U.S. Crude Production: 5,101,000 bpd
Increase from Year Ago: 741,000 bpd
Percent Increase: 16.9%

Gasoline Demand: 9,622,000 bpd
Increase from Year Ago: 595,000 bpd
Percent Increase: 6.5%

U.S. Average Retail Regular Gasoline Price: $2.72
Decrease from Year Ago: 11.1%


Figures for Year Ago Weekly Amounts:
U.S. Crude Production: 4,360,000 bpd
Gasoline Demand: 9,027,000 bpd
U.S. Average Retail Regualar Gasoline Price: $3.06

Saturday, September 02, 2006

Arena Resources #2 on IBD 100 List
Report in September 5th Edition; Coverage Begins on Page 1B

Friday, September 01, 2006

Why Owning too Many Stocks is Nothing More than a Hedge Against Ignorance
Examination of One Investor's Portfolio Reveals a Serious Problem: Too Many Stocks

Northbeach,
your post indicates that you own way too many stocks in your portfolio. 12 stocks is enough to be considered a mutual fund. Owning so many stocks is nothing more than a hedge against your ignorance.

I have some questions for you:

1. How in the world are you able to follow so many companies at one time? IMHO there is no way you can keep up on all 12 companies without compromising the thoroughness of the information you maintain on each company.

2. Why do you own so many stocks? (Why don't you just own the most promising company in each of your three categories?) I believe I know the answer to this question. You have so many companies in your portfolio that you know very little about each one. In other words, you are hedging your ignorance.

By comparison,
I own only 1 company in my portfolio.

U.S. E&P: ARD (100%)

I am up 41.5% YTD. You are up only 29.3% YTD.

At this time I am not hedging my ignorance. After tremendous amounts of research and analysis I have determined that ARD is fundamentally superior with better growth prospects than any other company in the oil sector. Additionally, ARD has significant margin of safety. In other words, there is a major gap between intrinsic value and current share price. The reason I invest in ARD is to take advantage of Peak Oil. Keep in mind that there is no shortage of worldwide natural gas spare capacity unlike crude oil where there is a shortage of worldwide spare capacity. I'm pleased to announce that ARD is a leader in percentage of oil produced as well as percentage of oil proved reserves (86.2% and 83% respectively.)


sincerely,
Dok