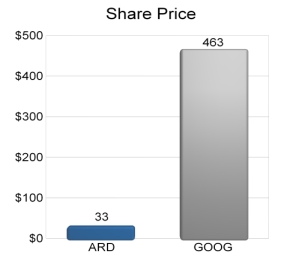
ARD Closes at $36.47 a New Record
Market Cap now Exceeds $476 million
Headline only.
Market Cap now Exceeds $476 million
Headline only.
posted by -Aztec- at 5:19 PM
![]()
"The Biggest Little Oil and Gas Company on the Planet."
posted by -Aztec- at 5:19 PM
![]()
posted by -Aztec- at 5:36 AM
![]()
posted by -Aztec- at 10:24 PM
![]()
posted by -Aztec- at 8:01 PM
![]()
posted by -Aztec- at 7:06 AM
![]()

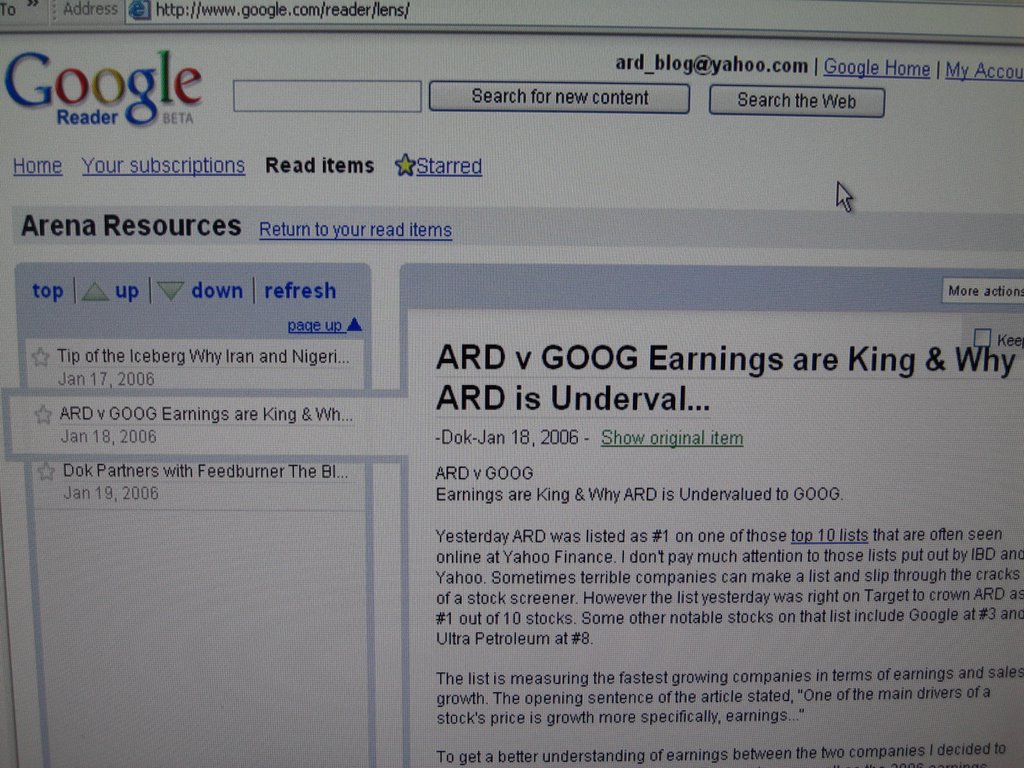
Google also offers a Google homepage as a way to stay current on blog entries. The page view below would be an example of what the Google homepage would look like with the ARD blog syndication added.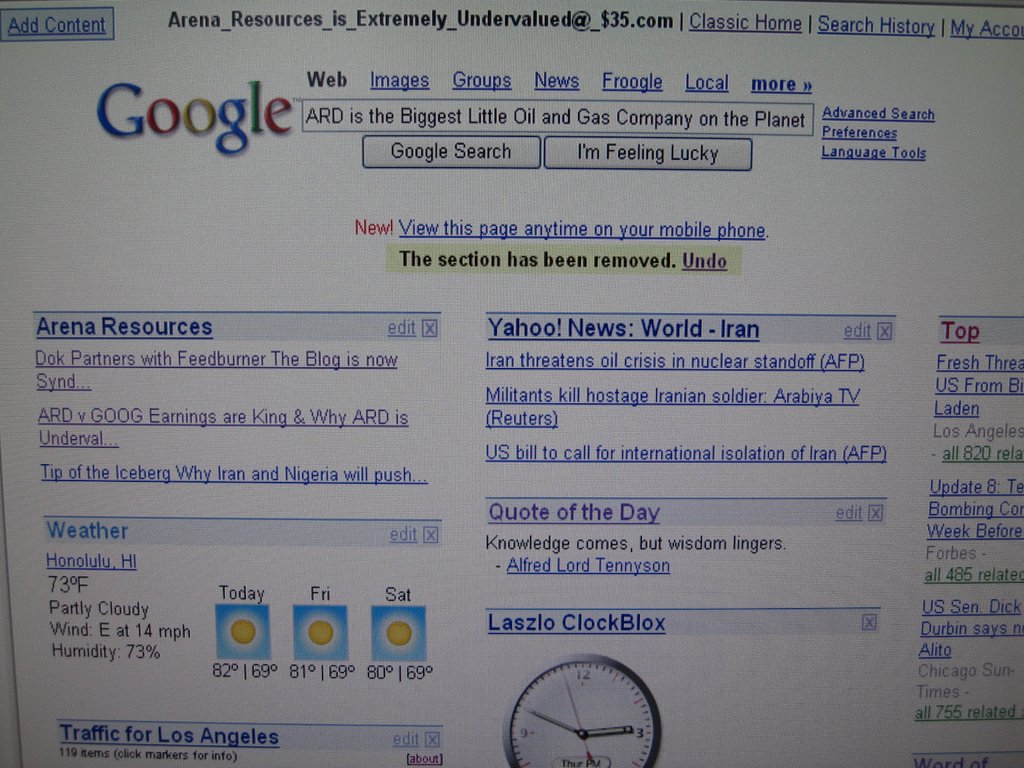
(Click on image to enlarge.)
The subscription feed will allow you to read the blog with black text and a white background. I have received some feedback from ARD blog readers who prefer a white background and black text for easier reading.
If you prefer to continue to visit this blog directly by bookmarking the webpage that is still a good option. This method still allows you to click on the orange Feedburner icon to view the blog with reversed colors (white background and black lettering) if you so desire.
In any case I am always trying to make the blog better than ever. If you have any comments, questions or opinions about the blog or how to make it better please email me at:
doktor_stocks@yahoo.com
I am also considering the addition of an editorial page where readers of this blog can email me if they wish to (as Bill O'Reilly says) opine. Again all your comments are encouraged and appreciated both positive and negative. I will reply to all emails as soon as possible when a reply is required.
Dok's Recommended Reading
The recommended reading list are books that I have read or are on my list to read. Most have already been read. These are books that can enhance your understanding of peak oil, the history of oil, investing, politics, accounting, etc. You can even search for any book from the links on this website. If you feel the desire to purchase a book it would be appreciated if you would consider making your purchase via this website. Amazon.com gives me credit when books are purchased from their links that are on my website. Any credit would be like putting a dollar in my tip jar.
My hope is that you enjoy visiting this site, find the analysis educational, the information presented useful and are able to profit from it all.
Sincerely,
Dok
posted by -Aztec- at 1:37 AM
![]()
posted by -Aztec- at 3:18 AM
![]()

posted by -Aztec- at 7:49 AM
![]()
posted by -Aztec- at 1:23 PM
![]()
posted by -Aztec- at 12:29 PM
![]()
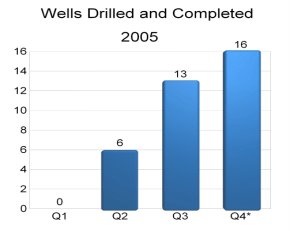
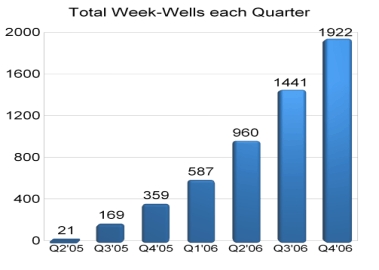
The number of wells to be drilled in Q4 is an estimate based on the stated objectives in the above press release.
Understanding Well-Weeks
The next step is to determine how much production potential has been created in Q4 as a result of having drilled 16 wells. Each well that has been completed and producing for 1 week generates one well-week (W.W. for short.) For example if one well has been producing oil for five weeks it has produced five W.W. One more example would be if three wells have been producing for 10 weeks the resultant number of W.W. would be 30.
How many W.W. were created in Q4 2005? Since there were 16 wells estimated to have been drilled simply divide 16 by 13 (the number of weeks in Q4.)
16/13 = 1.23 wells drilled each week.
How many well weeks total?
________Wells Drilled____Weekly Total____Quarterly Total
Week 1........1.23.............1.23...............1.23
Week 2........1.23.............2.46.............3.69
Week 3.........1.23.............3.69..............7.38
Week 4.........1.23.............4.92............12.3
Week 5.........1.23............6.15.............18.45
Week 6..........1.23...........7.38............25.83
Week 7..........1.23............8.61............34.44
Week 8..........1.23............9.84............44.28
Week 9..........1.23...........11.07...........55.35
Week10.........1.23...........12.30............67.65
Week11........1.23.............13.53............81.18
Week12.........1.23.............14.76.........95.94
Week13.........1.23.............15.99........111.93
The weekly total is the number of well-weeks generated each week. The quarterly total is the cumulative number of well weeks generated. At the end of the quarter you will notice that 111.93 well-weeks will have been created.
Now the next step is to put a value on each well-week.
In 2005 Q3 production increased 31,367 Bbl (from Q2 oil production total of 92,233 to Q3 total of 123,600.) It should also be noted that Q3 had 169 well-weeks.
If we divide the increase of 31,367 Bbl Oil in Q3 by the number of well-weeks we get:
31,367 / 169 = 185.6
Lets round that quotient down to 185 for simplicity. This number simply means that each well produced 185 Bbl per week. (Keep in mind that this is an estimate and assumes that gains from refracs are added in as well as natural declines in production.)
We have determined that Q4 will alone create 112 (rounded from 111.93) well weeks as determined from above. However we must also add in the number of well-weeks from Q2 and also from Q3. Please note that although the number of well-weeks created in Q4 2005 was 112 when we add in Q4 well-weeks for figuring Q1 2006 the 112 w.w. effectively increases to 208.
How does the number of well-weeks corresponding with Q4'05 magically increase from being 112 in Q4'05 to 208 well-weeks in Q1'06?
The total number of wells in Q4'05 (16) are all pumping oil for every week in Q1'06. Since there are 13 weeks in each quarter the math is as follows:
16 x 13 = 208.
Please keep in mind that this is part of the process in determining the total number of well-weeks for each quarter in the chart below.
(Click on image to enlarge)
Now that we have determined the number of well-weeks in each quarter and have determined from above that each well-week is initially valued at 185 Bbl we can figure out the quarterly production.
As it is natural for oil production to decline over time we must also add in the natural production declines to get the most reliable oil production totals. There was only a 2% annual decline rate for Q4'05 as I feel refracs would compensate for any additional declines. However beginning with Q1 2006 I have included natural decline rates as follows:
Annual Decline Rates*
Q1 2006____(-6.4 %)
Q2 2006____(-6.6 %)
Q3 2006____(-8.9 %)
Q4 2006____(-9.1 %)
*Quarterly rate x 4 = annual decline rate.
In order to factor in the above projected natural decline rates the estimated amount of production per Well-Week is reduced. The Production per Well-Week figures are as follows:
Q3 2005_____185 (Base quarter.)
Q4 2005_____184 (-2 %)
Q1 2006_____181 (-6.5 %)
Q2 2006_____178 (-6.6 %)
Q3 2006_____174 (-8.9 %)
Q4 2006_____170 (-9.1 %)
The above decline rates are conservative as I feel the above decline rates overstate the actual declines. I would rather have my quarterly oil production figures error on being too conservative (small) than too aggressive (large.)
Please also note that the oil production figures below do not yet include any natural gas production. 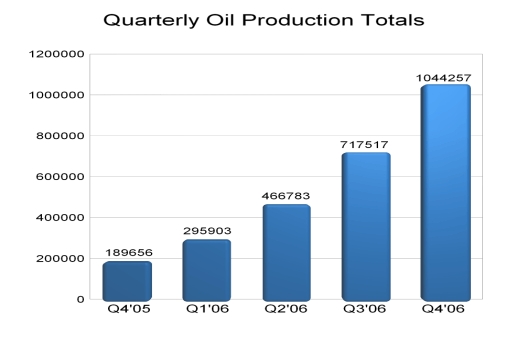
(Click on image to enlarge)
The above chart indicates total oil production for each quarter only. We must still add in the gas production totals.
Gas Production
Based on my analysis of gas production by state and the associated trends I am calling for Q4 2005 gas production in terms of Mcf as follows:
TX: 62,000
NM: 42,000
OK: 10,000
KS: 35,000
Total: 149,000 Mcf or 24,833 BOE
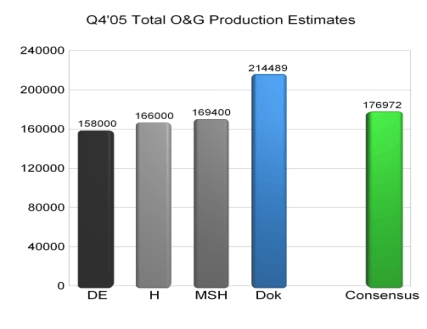
With Q4 2005 oil production of 189,656 BOE and gas production of 24,833 BOE we should achieve a total Q4 2005 figure of 214,489 BOE.
189,656 + 24,833 = 214,489
Based on $54 realized price per BOE we will achieve a total revenue figure of $11,582,406 in Q4 2005
214,489 x $54 = $11,582,406
Based on a Net Profit Margin of 49% I forecast Net Income of $5,675,378
$11,582,406 x 0.49 = $5,675,378
Based on a share count of 13.4 million shares the fully diluted EPS (Earnings per Share) should be $0.42 for Q4 2005.
$5,675,378 / 13,400,000 shares = $0.42
Q4 2005 Forecast Summary:
Total Oil and Gas Production: 214,489 BOE
Revenue: $11,582,406
Net Profit Margin: 49%
Net Income: $5,675,378
Shares Outstanding: 13.4 Million
Q4 2005 EPS: $0.42
In conclusion, it is easy to see that Arena Resources is not only an oil and gas company but also a goldmine.
posted by -Aztec- at 6:08 AM
![]()
 Understand the Longterm Value of Owning ARD Shares.
The book Twilight in the desert is a must read for those who own shares of ARD. It provides the necessary insight into understanding what is really happening inside Saudi Arabia's petroleum industry and more specifically Saudi ARAMCO. I read the book and found it a very good read. It definitely gives you a deeper understanding of not only the history of where the world's largest oil producer has been but a good idea of what the future holds and why. The world's largest oil field is located within Saudi Arabia. It is amazing that this field has been in production for over 50 years! All is not well though as this book will explain. You won't be sorry for investing the time to read the book.
I know ARD is one of the "biggest little oil and gas producers" on the planet. However reading "Twilight in the Desert" gives me the desire to continue to add to my ARD position. I know longterm it will be the investment of a lifetime. Peak Oil will provide a bullmarket for oil and gas stocks that will be like no other. The bull run in oil and gas stocks will make the tech bull market of the late 1990's pale in comparison. Peak oil will provide an investment opportunity that will be far greater than even the internet.
To have the best returns you will want to own the best of the best. ARD certainly is without a doubt a company that I would consider the 'best of the best.'
Here is a link to a recent interview of Matthew Simmons that you may also find interesting.
posted by -Aztec- at 7:06 AM
![]()
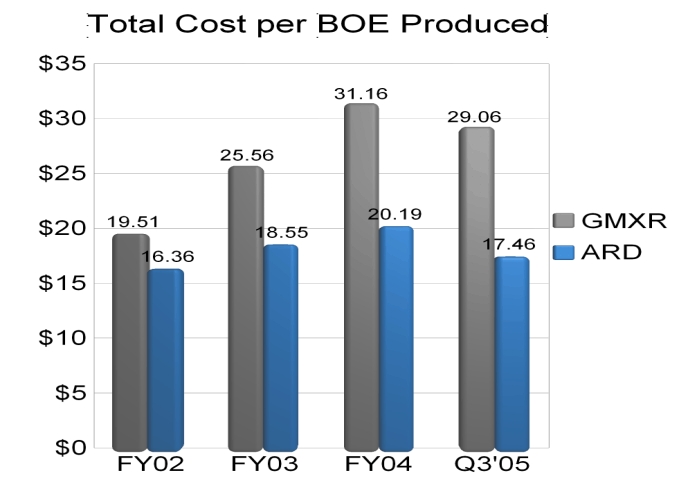
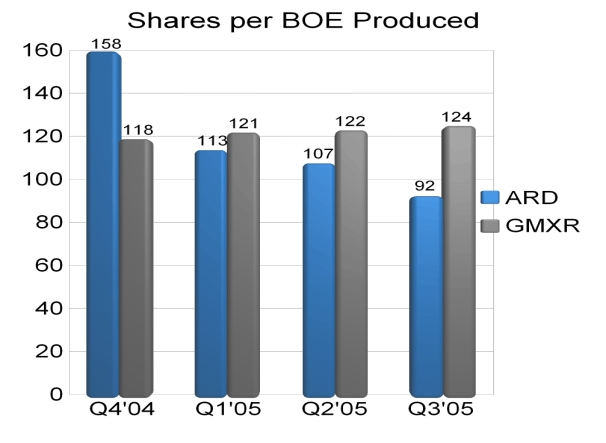
Shares per BOE indicates the number of shares required in order to "own" one BOE of production. Note how ARD shares per BOE produced has been dropping for each and every quarter while GMXR shares per BOE produced has been rising for each and every quarter. Put another way, production per share is increasing at ARD and decreasing at GMXR.
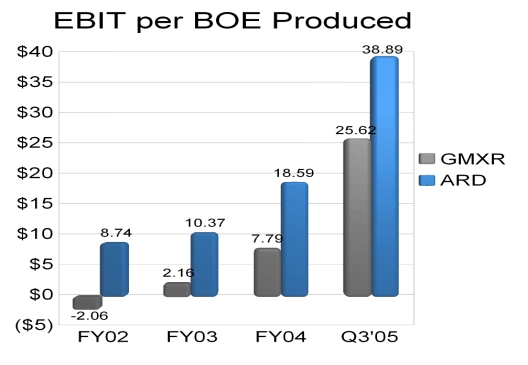
In conclusion, with the combination of ARD being able to earn more for every BOE produced AND and the ability to produce more BOE both in absolute terms and on a per share basis it should be elementary that ARD EPS will exceed that of GMXR in 2006. On this basis alone ARD shares would offer the more compelling investment. However, in previous posts it has been determined that ARD is the superior franchise to GMXR in virtually every statistic. ARD valuation is poised to surpass that of GMXR not only in terms of the various ratios that include Price to Earnings and Price to Sales but also in terms of share price.
posted by -Aztec- at 12:57 PM
![]()

