ARD Shares Are Currently UndervaluedBenchmarking Indicates Significant UndervaluationBenchmarking ARD Production Growth, Earnings per Share Growth, EBIT Margin and 2007 Forward P/E with the Domestic Oil Producer Peer Group Indicates Significant Undervaluation. ARD production and earnings growth for the first 9 months of 2006 is leading the entire peer group. (Click here to learn how the peer group was selected.) ARD also has an EBIT margin that is tops among the peer group. Given the fact that ARD has outperformed the peer group both past and present in addition to a future that is every bit as bright as any company within the peer group it is amazing that ARD has a 2007 forward P/E ratio that is below the peer group average. Based on future growth prospects ARD probably has one of the brightest if not the brightest outlook. Therefore, ARD shares are without a doubt undervalued in relation to the peer group.The charts below indicate ARD with the blue bar. The average of the peer group is indicated by the red bar. Chart one below depicts ARD production growth of oil and gas exceeding every company within the peer group. In fact ARD oil and gas production is nearly 3 times greater than the average.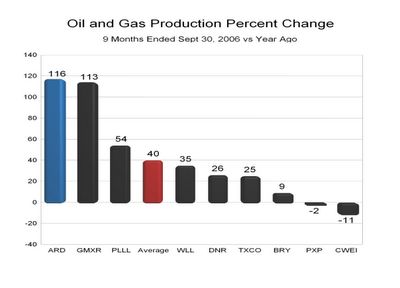
Chart 1 (Click on image to enlarge)
Chart 2 below indicates that ARD superior oil and gas production is driving superior earnings per share. It is interesting to note that not only is ARD leading the peer group in terms of EPS growth YoY but the ARD growth rate is over 3.5X that of the peer group average.
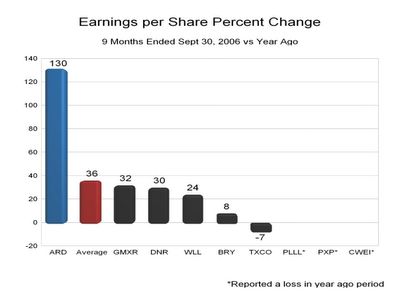
Chart 2 (Click on image to enlarge)
Below in Chart 3 we find that ARD is also the leader in EBIT margin. EBIT margin is defined as earnings before income taxes as a percentage of revenues. The fact that ARD is a leader in EBIT margin also indicates that ARD has an extremely low cost structure. Businesses with a higher margin and lower cost structure than their peers deserve a valuation premium. It is amazing how ARD exceeds the company with the second best EBIT margin by a whopping 53%. ARD's EBIT margin is nearly double that of the peer group average. This is truly amazing.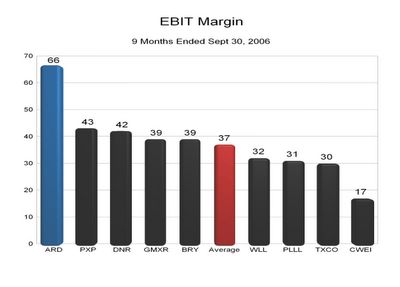
Chart 3 (Click on image to enlarge)
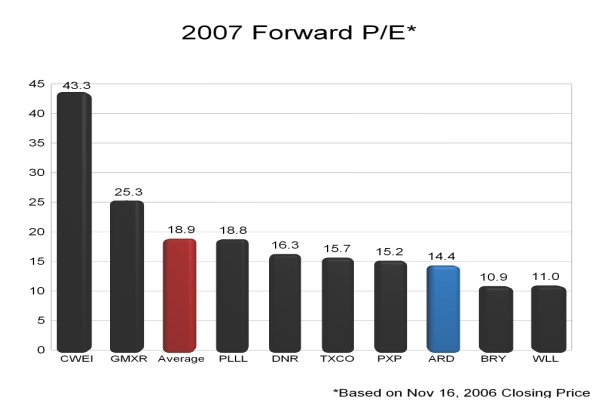
Given the facts above, it is most amazing that ARD superior performance, fundamentals and future prospects are overlooked by virtue of ARD having a below average 2007 forward P/E as indicated in chart 4 below. It is interesting to note that the peer group average 2007 forward P/E is actually 31% higher than that of ARD.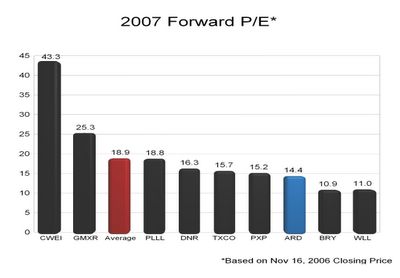
Chart 4 (Click on image to enlarge)
Golden Opportunity
ARD Shares present investors with a golden opportunity to own shares of a superior company at a significant discount to the market. This discount not only provides enhanced share price appreciation potential but also increased margin of safety. With tremendous growth in production and ultimately earnings per share in concert with an increasing 2007 forward PE multiple as the market recognizes the current excessive discount in relation to Arena's peers, these shares are poised for explosive upside potential. In other words, ARD share price will explode to the upside based on growth in earnings as well as P/E multiple expansion. Always remember that the three most important drivers of share price appreciation are (in no particular order): Earnings, Earnings and Earnings.


