ARD Price Target FY07: TBA
ARD EPS Estimate FY07: TBA

Friday, October 27, 2006

ARD Chairman Stan McCabe Unloads 300,000 Shares Between Completion of Q3 and Release of Actual Results
Expect Q3 Results to Impress; The Alternative Would be Insider Trading and an SEC Investigation

It is amazing that ARD produced 295,000 BOE in Q3 along with estimated Revenue of $17.9 million as per the Q3 Operational Update. Expect ARD to impress with final results. Outlook for Q4 should be positive. For a chairman of a publicly traded company to sell at such a sensitive time (after the close of a quarter but before the release of the actual results) in the presence of bad news or simply lackluster performance would merit an SEC investigation for insider trading. (View the SEC filing here.)

The management team at Arena Resources is superior. Any thought of insider trading would be uncharacteristic of such a talented management team. Therefore, one should fully expect another quarter with excellent results to be posted possibly as early as next friday with the company conference call to follow on the following Monday. (Don't be surprised if the company 10Q is released after the close of trading on Friday, November 3 with the third quarter conference call to be scheduled promptly at 10amCT on Monday, November 6.)

Monday, October 23, 2006

Can Saudi Arabia Expect to Top Record Oil Exports of 1980?
Geology of Oil Fields and Saudi Population Growth may Make such a Feat Impossible


Saudi Arabia is the world's largest producer of crude oil. In 2005 Saudi oil production was estimated at 9.3 million barrels/day (b/d.) Based on total worldwide production (84.3 million b/d) Saudi production accounted for 11%. Since Saudi Arabia is the world's largest producer of oil it is only logical that their production, consumption, and exports should be under the microscope and closely watched.

In his book, "Twilight in the Desert," Matthew Simmons pieced together the evidence that indicates major problems with Saudi Arabia's major oil fields and specifically the world's largest: Ghawar. Many of the problems originate with the fact that the largest oil fields were discovered first. Hence they are the oldest. Elderly oil fields tend to have 'health problems' just like elderly people do. In the case of old oil fields the major problem is declining production. Certainly there are steps that are taken to treat the 'symptoms' of declining oil production. Over time maintaining (let alone increasing) production becomes very challenging.

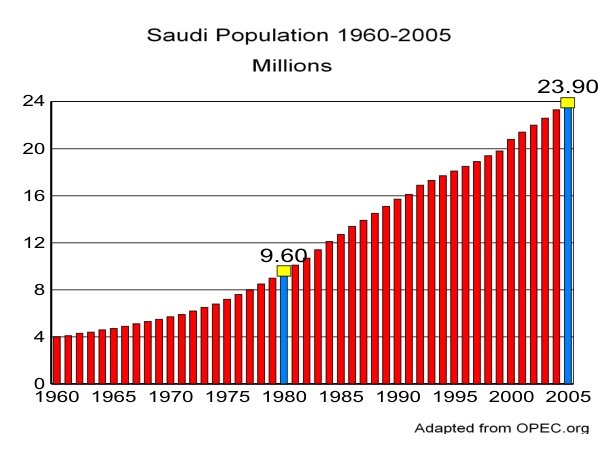
While many focus on the problems associated with the Saudi Oil fields one must not discount the problems created by Saudi Arabia's increasing population. Saudi Arabia is a country with a rapidly expanding population. Between 2000 and 2005 the Saudi population increased by an average of over 600,000 people each year. The chart below depicts yearly estimated Saudi population between 1960 and 2005.

(Chart 1)

(click on image to enlarge)

The chart above depicting 
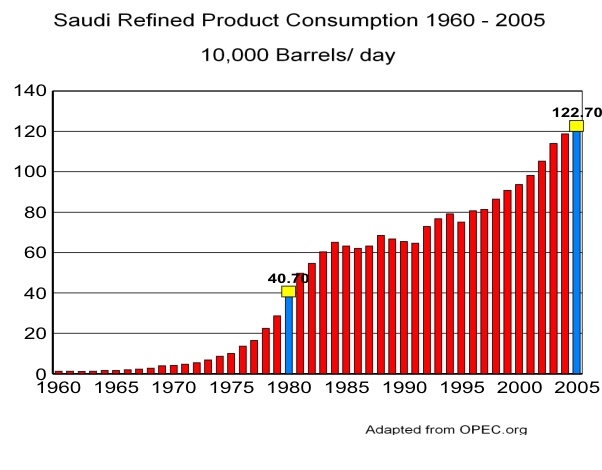
Saudi population (Chart 1) indicates that the population was 9.6 million people in 1980 and 23.9 million people in 2005. In other words the population was just about 2.5 times larger in 2005 than in 1980. This change took place in a span of 25 years. With a growing population it is only evident that the Saudi society will have larger oil requirements. Chart 2 below depicts Saudi refined product consumption between 1960 and 2005.


(Chart 2)

(click on image to enlarge)

Again if we take a look at 1980 it is noted that the refined product consumption was 407,000 b/d as noted in chart 2 above. In 2005 internal consumption increased to 1,227,000 b/d. During the 25 year span between 1980 and 2005 Saudi refined product consumption more than tripled.

Based on this fact it should be extremely evident that Saudi oil exports will be limited not only by the geological problems associated with production but also with the country's internal thirst for oil consumption.

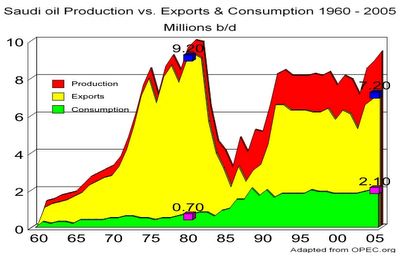
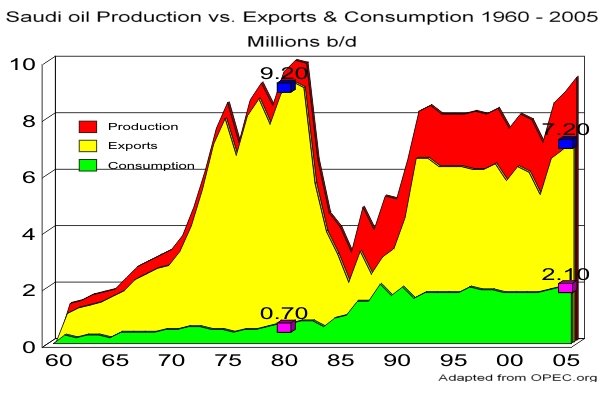
The chart below (chart 3) highlights Saudi oil production, exports and consumption between 1960 and 2005. The red area indicates Saudi production each year in terms of millions b/d. Saudi Arabia's best year was 1980 when they produced an average of 9.9 million b/d. Fast forward 25 years and they were only able to produce 9.3 million b/d. Keep in mind that production is depicted in the red area. In order to match 1980's production level Saudi Arabia would have to increase production by about 600,000 b/d or 6.4%.

Due to population growth we already discussed how Saudi Arabia has increased demand for oil productions as depicted in chart 2 above. In chart 3 below we have determined the amount of oil Saudi Arabia produces and then consumes (demand and/or storage) simply by subtracting published exports from published production figures. The amount of Saudi production that is used within the country is depicted with the green area. In 1980 Saudi Arabia kept 1 out of every 14.1 barrels of oil produced for internal consumption (7.0%). In 2005 Saudi Arabia kept 1 out of every 4.4 barrels produced (22.6%). The pink squares denotes 1980 consumption of 700,000 b/d and 2005 consumption of 2.1 million b/d.

Not only does Saudi Arabia have to find ways to replace production that is lost to geological natural decline in the oil fields but in order to maintain their exports at 1980 levels they must now produce an extra 1.4 million b/d to account for the increase in Saudi oil demand caused in large part to the growth of the Saudi population. One can certainly count on the population to continue growing along with their demand for oil.

(Chart 3)

(click on image to enlarge)

Saudi Oil Exports
The yellow shaded area in chart 3 above indicates the oil that was actually exported. In 1980 total exports amounted to 9.2 million b/d. In 2005 total exports came in at 7.2 million b/d. What caused exports to decline? Actual production declined by 600,000 b/d. Internal consumption of oil increased by 1.4 million b/d. If we add these amounts up we come up with 2 million b/d in reduced oil exports. 2005 Exports would have to be increased 27.7% to match 1980 exports.

In order to export 9.2 million b/d as was done in 1980 and to satisfy the oil needs of the Saudi population in 2005 (2.1 million b/d) total production would have to equal 11.3 million b/d. Given the fact that estimated 2005 Saudi production was 9.3 million b/d we would need to see an increase of 2 million b/d (21.5%) from 2005 levels.

In conclusion, given the fact that Saudi Arabia has serious problems with their oil fields of which most notable is the Ghawar (world's largest oil field) along with Saudi Arabia's growing growing thirst for oil it should come as no surprise that the chances of Saudi Arabia ever matching the level of exports in 1980 is extremely doubtful.

Wednesday, October 18, 2006

GMXR Earnings Projections: A Look Back to March 10, 20006
On this Date My GMXR Estimate for FY2006 was $0.67 with Analyst Consensus of $1.67; Which Estimate was More Correct?

On March 10, 2006 my estimate for GMXR FY2006 EPS was $0.67. This estimate was computed and promptly posted on this blog at that time. On this same date (March 10, 2006) the GMXR Analyst Consensus was for $1.67 as recorded by my series of posts on the Yahoo Message Board in March of 2006.

This post dated March 15, 2006 on the Yahoo Message Board indicates my estimate of $0.67 for GMXR in FY2006 as posted 5 days prior on this blog. It was on March 15, 2006 that the analyst consensus estimate was lowered from $1.67 to $1.59 for FY2006.

Fast Forward to October 18, 2006...
The analyst consensus for GMXR FY2006 EPS has dropped from $1.67 on March 10, 2006 to the current estimate of $0.66. It was evident back in March that GMXR was having serious problems with their operation with no chance of posting FY2006 EPS of $1.67. My calculations back on March 10, 2006 that GMXR would earn only a fraction of the consensus Wallstreet estimate is testimony that the average guy can make projections that end up being more accurate than that of the Wallstreet analyst. Many of these analysts have MBAs from Ivy League universities with impressive resumes. While I do in fact have a 4 year degree (Bachelor of Science), it is not in a field even remotely similar to that of the average Wallstreet analyst. I did however take Accounting 101 as well as ECON 101 as electives. In other words, I have no formal education in finance, accounting, business or the like. I feel this is to my advantage (I don't over analyze.) With simple math and a basic understanding of what makes a good company one can look at SEC filings and determine if a company is undervalued. Earnings projections are quite simple and require nothing more than simple 8th grade math skills.

In conclusion, my estimate of $0.67 on March 10, 2006 was $1 below the analyst consensus of $1.67 on this date. In other words, my estimate was only 40% of what Wallstreet analysts were calling for. Today, Wallstreet has lowered their projections in-line with my projections that were made over 7 months ago. Today the Wallstreet consensus is for GMXR to earn $0.66 in FY2006. The fact that my March 10, 2006 estimates for GMXR are looking to be much more accurate than the highly educated Wallstreet analyst is proof that the average retail investor can make better investment decisions and projections based on one's own research. It is my hope that this blog will serve to educate and prove how average retail investors 'armed' with basic knowledge and simple math can "beat the street."

Monday, October 16, 2006

ARD Limit Order Filled @ $36.63

I'm putting my money where my mouth is. Rational for today's purchase:

1. ARD continues to sell at impressive discount to intrinsic value of shares based on oil assets per share.

2. Production growth continues to impress. (2007 production should be significantly larger than 2006 production.)

3. Oil prices are near a bottom ($58-$59 range.) OPEC will conduct an emergency meeting on October 19, 2006 to discuss and work out details of at least a 1 million bpd production cut.

4. Elections are 16 trading days away. Investors (both retail and institutions) will pour vast amounts of money into oil and gas equities in anticipation of post election rise in oil prices. This is already starting to happen.

5. Tim Rochford filing to sell 100,000 shares on October 8, 2006. (News release posted on October 13, 2006.) Because Q3 is complete and the results have not yet become public any share sale by the CEO as a result of a quarter with lackluster results or worse would lead to SEC scrutiny. In other words, Tim Rochford (ARD CEO) would be unwise to sell 100,000 shares with any kind of disappointing Q3 results in any way shape or form. One can conclude that Q3 was a success in terms of revenues, production, net income and EPS.

6. ARD management continue to hold sizeable position in ARD shares.

7. The St.Louis formation (oil bearing structure at 5400'+) in Southwest Kansas could be of a magnitude of Furhman-Mascho or larger. ARD will drill 1-2 test wells in this formation during Q4. By the time the Q3 C.C. rolls around in early November there could very well be some initial results to report. This could be a wild card.

8. The shoulder season is coming to an end. We are now entering the winter heating season.

9. By Q1 of 2007 ARD should report a large increase in proven reserves (mostly oil.)

In conclusion, there are currently a significant number of drivers to push ARD share price higher from current levels. Expect a new record high in ARD share price before year end.

Saturday, October 07, 2006

Q3 Operational Update Commentary

Operationally the company met or exceeded every projection from the Q2'06 C.C. with only one exception. The lone exception was a projection of 6 development wells on Seven Rivers Queen to be drilled in Q3. There were actually 2 wells drilled on this property. In order to meet the total wells drilled projection for Q3 the company drilled 3 extra wells on the Fuhrman-Mascho property, 1 extra well on the Eva South property in OK, and 1 extra well on the Ona Morrow property in OK. (Keep in mind that if one added up all the individual wells to be drilled by property as projected in the Q2'06 C.C. the total would come out to 35. However, the company projected 36 total wells at that time allowing for one additional well to be drilled somewhere.)

ARD Incremental Oil and Gas Production

The quarter over quarter growth in total oil and gas produced was very impressive. The incremental increase produced (Q3 over Q2) was about 53,940 BOE (295,000 to 241,060 BOE.) The previous quarter (Q2) saw a quarterly incremental increase of 50,271 BOE (241,060 to 190,789.) On an absolute basis the change in incremental oil and gas production between Q3 and Q2 when compared to Q2 and Q1 increased 3669 BOE. This translates into a 7.2% increase in absolute incremental production in the Q3-Q2 period over the Q2-Q1 period. Considering that this increase occurred in the face of the natural declines in the ever expanding inventory of wells says a lot. To be clear, it means that the 295,000 BOE produced was very impressive.

We should realize about 85% of total production being oil. This is down slightly from the 86.2% reported in Q2. Given the fact that NG prices are so depressed and given the fact that the vast majority of domestic E&P companies have well under 50% of total production being oil, one should expect Arena Resources to command an earnings multiple premium to other oil and gas producers.

Benchmarking ARD with 2 Other Companies

Currently ARD shares command significant value based on the fact that comparisons to other companies with larger market caps (slower growth prospects) and/or higher percent production being NG reveal that the other companies in the comparison have a higher earnings multiple than ARD. In other words 2 other companies that are fundamentally inferior with slower growth prospects have an unjustified earnings multiple premium when compared to ARD.

For example UPL is growing production, revenues, net income and EPS slower than ARD (ARD has the better future prospects.) UPL also has a higher percent of production in NG. Currently the market is giving UPL an earnings multiple of 29 in comparison to the ARD earnings multiple of 28.

One other example of the ARD earnings multiple being lower than another company that produces a significantly lesser amount of oil as a percentage of total production is GMXR. GMXR has less than 10% production in oil. Also GMXR growth in production, revenues, net income and EPS is much slower than ARD. (ARD has the better future prospects.) Currently the market is giving GMXR an earnings multiple of 38 in comparison to the ARD earnings multiple of 28.

Since ARD will grow earnings faster than both UPL and GMXR we can also conclude that ARD currently has a lower foward PE than both UPL and GMXR.

Expect that ARD earnings multiple to continue to expand back into the mid 30's or higher.


What can we expect for Q3'06 earnings?

Revenues: $17.9 million........ (up from $14.69 mm in Q2'06)
Net Profit Margin: 42%......... (down from 43.8% in Q2'06.)
Net Income: $7.51 million.....(up from $6.44 mm in Q2'06.)
Share Count*: 15 million.......(up from 14.64mm in Q2'06.)
*(Fully diluted)
EPS: $0.50.......(Up from $0.44 in Q2'06/ $0.27 in Q3'05.)

The projected quarter over quarter decline in net profit margin is a result of the potential for "other expenses" increasing due to NYSE listing fee requirements of at most $150,000. We'll have to wait and see how much of the listing fees are expensed in the third quarter. In terms of EPS this ($150,000) amounts to one penny ($0.01.)

Ttm Earnings will increase to $1.40. Put a earnings multiple of 29 on these earnings and you have a share price of $40.60. A more realistic multiple would be 35. This would yield a share price of $49. (One Wall Street firm recently put a target price on ARD shares of $49.)

The 1 year chart below indicates that ARD has been making higher lows and higher highs.


ARD 1 Year Price Chart

Expect the trend to continue as ARD earnings per share increase over time. The three most important drivers of share price appreciation are earnings, earnings, earnings.


Monday, October 02, 2006

Hypothesis on Why Oil Declined From $78 in August to Low $60s if in Fact Peak Oil is Real

When supply is closely matched to demand little things can cause the price of oil to fluctuate significantly. For example such things as a hurricane in the Gulf of Mexico, a colder than normal winter, oil worker strike in Nigeria, concerns on Iran, sabotage can cause the price of oil to fluctuate significantly higher.

In contrast there are events that can also cause the price of oil to fluctuate significantly lower even though supply is closely matched with demand. Such events include a warmer than normal winter, a lack of hurricane activity in the Gulf of Mexico, lack of concern over Iran, U.S. government decisions, higher than average inventory levels to name a few.

We have been lucky with world events since August of 2006. In this time concerns over Iran have declined. Actually since autumn of 2005 we have been very lucky by virtue of having experienced a warmer than normal winter along with an absence of hurricanes this year in the Gulf of Mexico. Inventories have been built up for a worst case scenario (cold winter, hurricanes, problems with Iran, etc) and we have in fact experienced a best case scenario.

So here we sit with oil inventories at 5 year highs and the price goes down from $78 a barrel in August to the low $60s currently and now Wall Street analysts, the media, traders who are short oil and economist claim that there was never any Hubbert's peak and that peak oil was a myth because, "The price has gone down."

This feeling that low oil prices are here to stay or that they may even go lower will quickly be dispelled as soon as we experience a little bit of bad luck such as a colder than normal winter, Iran becoming an issue again, OPEC announcing significant cuts, a hurricane, natural disaster, terrorism, or quite simply the passage of time. As time passes the gap between supply and demand will become even tighter or worse: demand exceeding that of supply. One can certainly expect demand to continue to climb higher especially with current prices. One can also expect worldwide supply to continue to flatten out as the worlds largest oil fields continue to go into decline by virtue of their old age. Spare capacity will continue to be squeezed out of the system with the passage of time.

In conclusion, expect prices to offer significant fluctuations both to the upside and to the downside due to supply and demand being so close. Having a little bit of good luck as previously described will offer a false sense of security that everything is just fine when in fact it is not. It would not be surprising at all to be back above $70 within 3 months time. Enterprising investors will take advantage of any significant market fears of declining oil prices and subsequent market panic selling to increase or initiate positions in quality oil companies or drillers. It is precisely at this time when the outlook appears the gloomiest when ownership in these equities offers the most promise and profits.