ARD higher at $33
ARD Price Target FY07: TBA
ARD EPS Estimate FY07: TBA
Tuesday, March 28, 2006
Friday, March 24, 2006
'Twilight in the Desert' Author, Matthew Simmons, Speaks at Duke University
Those wanting to learn more about peak oil should take the time to view this slide show complete with audio.
Thursday, March 23, 2006
GMXR has Until March 31, 2006 to Submit Form 10-K to the SEC
Previously we learned that GMXR has had 3 of the last 4 10Ks submitted late. The only 10K submitted within the allowable time (2004) was actually submitted on the last day of the allowable reporting period. The SEC website has a wealth of information on this topic.
Wednesday, March 22, 2006
GMXR SEC Filings Reveal Numerous Late Filings in Last 5 Years
A close examination of SEC filings submitted in the last 5 years was very revealing for both GMXR and ARD. Since 2001 ARD has never been tardy submitting an SEC filing in the history of the company. ARD's perfect record of SEC documents being filed in a timely manner is a testament to the quality of management. In stark contrast, GMXR has had 6 late SEC filings (three 10Ks and three 10Qs.) A closer examination of the late 10Ks filed reveals a disturbing pattern: Three of the last four 10Ks (years 2001, 2002, 2003) have been late. Based on that pattern of behavior I would not be surprised if the 2005 10K is late also.
Case in point: GMXR has already released their revenues and net income results for fourth quarter and year end 2005 but there is no corresponding 10K for 2005.
In Contrast, ARD has released their record financial and operational results for fourth quarter and year end 2005 with the corresponding 10K for 2005.
One should expect GMXR to again be late on their 2005 10K. There is no excuse GMXR can give to satisfy GMXR investors. Late SEC filings are always a big red flag.
Below are the late filings and narratives on the SEC website.
1. GMX RESOURCES INC NT 10-K 3/30/2004 12/31/2003
PART III - NARRATIVEThe Company was unable to timely complete its audited financial statements for its Form 10-K for the period ended December 31, 2003, because of a lack of personnel and a delay in the receipt of the oil and gas reserve report by the Company.
2. GMX RESOURCES INC NT 10-K 4/1/2003 12/31/2002
PART III - NARRATIVE The registrant was unable to timely complete its Form 10-KSB for the period ended December 31, 2002 because of reductions in accounting personnel due to working capital limitations.
3. GMX RESOURCES INC NT 10-K 4/2/2002 12/31/2001
PART III - NARRATIVE The registrant was unable to timely complete its Form 10-KSB for the period ended December 31, 2001 because of a delay in receiving its reserve report from third parties necessary to complete the audited financial statements and other disclosures.
4. GMX RESOURCES INC NT 10-Q 5/14/2003 3/31/2003
PART III - NARRATIVE The registrant was unable to timely complete its Form 10-Q for the period ended March 31, 2003 because of reductions in accounting personnel due to working capital limitations.
5. GMX RESOURCES INC NT 10-Q 5/15/2002 3/31/2002
PART III - NARRATIVE The Company was unable to prepare financial statements in sufficient time to permit required review by its auditors.
6. GMX RESOURCES INC NT 10-Q 11/15/2001 9/30/2001
PART III - NARRATIVE The registrant was unable to timely complete its Form 10-QSB for the period ended September 30, 2001 because of its inability to obtain some of the required financial information from third parties.
Friday, March 17, 2006
The One Time Charge for Warrants in Concert with Sarbanes-Oxley Year End Accounting Pushed Costs Higher than Normal
The $597,773 one time Charge for Warrants on the income statement (page 55 of the 10K) had the effect of:
*Reducing Q4 fully diluted EPS by $0.04.
$0.22 with charge
*Reducing FY 2005 fully diluted EPS by $0.04
$0.75 with charge
*Increasing Total Costs per BOE Produced by $3.46
$26.17 with charge
*Reduced Net Margin an additional 6.3 Points
32.2% with charge
What happens if we ignore the $597,773 one time charge?
* Q4 fully diluted EPS is $0.26.
*FY'05 fully diluted EPS is $0.79 ($0.80 if rounding)
*Q4'05 Total Cost per BOE is $22.70
*Net Margin is 38.5%
Ignoring the one time charge my estimates of Net Margin and EPS would have been much closer. I was calling for:
Net Margin of 43.5%
EPS of $0.31
Instead of being off 25% on my Net Margin estimate I would have only been off 11%.
Instead of being off 29% on my EPS estimate I would have only been off 12% (9% if you round.)
The Sarbanes Oxley Year End accounting expenses is tacked on Q4. So that also had a significant impact of artificially reducing Q4 margins and EPS.
If you factor out the one time charge of $597,773 and expenses related to Sarbanes Oxley year end accounting I feel I"m very near the actual target Net Margin and Target EPS. Certainly I'll have to factor that in for Q4 2006. All in all I feel the Q4'05 and FY2005 results were a resounding success!
Thursday, March 16, 2006
A Look Back to Q4 2004 Reveals that this has Happened Before. Everything is Normal.
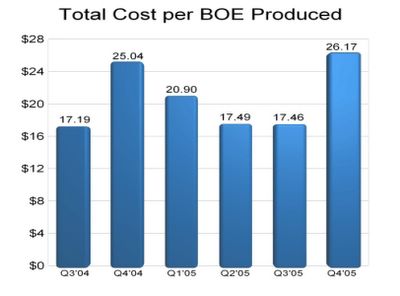
While some people are worried that ARD had a bad quarter I say relax! Not all metrics improve in a linear fashion every single quarter. Every company has challenges and Q4 seems to be a quarter in which ARD has the most challenges. One need only go back to Q4 2004. Take a look at the chart below? Does the rise in total cost per BOE produced look familiar? The numbers are amazingly familiar! Notice how Q4 in 2004 also saw a similar rise in total cost per BOE produced. This is nothing new. Take it in stride. If Q1 2005 is any indication as to what Q1 2006 will be like I think we can look forward to the total cost per BOE produced to decline next quarter and net margins to rise from current levels.
(Click on Image to Enlarge.)
Lets break down what I projected and what ARD actually came in at (2005 10K.)
Average Realized Price:
Estimate...$55
Actual.....$54.30
(I was off by 1.2%)
Revenue:
Estimate...$9.48mm
Actual.....$9.36mm
(I overestimated by 1.2%)
Net Margin:
Estimate...44%
Actual.....32%
(I overestimated by 27%)
Net Income:
Estimate...$4.07mm
Actual.....$3.01mm
(I overestimated by 26%)
Share Count:
Estimate...12.99mm
Actual.....13.09mm
(I underestimated by less than 1%)
All in all I nailed the:
1. Average realized price
2. Revenue
3. Share count
I was surprised and way off on my net margin...as was everyone else I"m sure. I have some theories on why I believe net margin came in 12 points below what I estimated:
1. Drilling program creates a lot of expense. These expenses are rising faster than the flow of oil from the wellheads. Hopefully in the future once production is established the LOE will decrease as infrastructure is already in place and paid for. I"m thinking that with all the new wells there will be more infrastructure requirements than most investors realize. I think Tim and Stan will mention something to this effect.
2. Possible delays in getting wells producing oil and connected to the system after the well has been drilled. Edadjootian mentioned that one of his concerns was ARD poking all the holes in the ground they want but just not being able to get them connected and producing in a timely manner. This may have something to do with the Q4 production being less than I anticipated.
3. Production declines greater than 6% yearly are being experienced in the oil patch in my estimation. This is one reason why I revised my 2006 Year end estimate from from something north of 2 million BOE to exactly 1 million BOE. If you take into account the greater than normal production declines in concert with the infrastructure intensive drilling program you have a recipe for lowered margins. I failed to take that into account and underestimated costs and thereby overestimating net margins. I"m hopeful that in the future when the infrastructure is in place that the production costs will be much lower thereby allowing net margins to again rise.
Was Q4 a complete failure? Absolutely not!
If you compare the Q4 YoY numbers ARD IMPROVED! For example, look at the 10K on page 72.
*Net margin increased from 29% to 32%
*Fully diluted EPS increased over 144%
*Revenues increased more than 215%
*Production increased YoY by 167% and QoQ by 22%. That is EXCELLENT folks!
*Shares per BOE produced improved to 77. 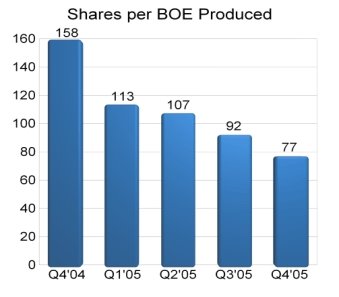
(Shares per BOE produced is a metric that indicates how many shares of ARD you need to own in order to "own" 1 BOE of production.)
And even with our relative "disappointment" surrounding net margin...it was 32%. Not many companies can boast such a fat net margin. No doubt Q4 was a challenging quarter. However once we get the infrastructure in place, costs will decline and BOE produced will continue to rise. Historically Q4 has been a challenging quarter for the company. Last year Q4 production decreased QoQ. In Q3'04 production was 69,763. In Q4'04 production dropped to 64,494. So In light of the disappointment surrounding net margin in Q4'05 and higher than expected expenses I think it was a successful quarter. Keep in mind that Oil companies typically have a higher cost profile than NG companies...yet even in a challenging quarter such as this ARD was able to produce at a cost profile of $26.17 per BOE. This still beat GMXR with a cost profile of $28.69 per BOE produced.The future looks bright. A second rig will be coming online. With the increased wells and infrastructure already being put in place margins will increase as production continues to increase. Q4 was certainly not a step backwards. It was a step forward. Hopefully management will provide more transparency, guidance and updates so we have a better idea of what to expect and a better understanding of how our company functions.
Wednesday, March 15, 2006
Friday Morning Call is Scheduled to Begin at 11E/10C/8P
The conference call is scheduled for the morning of Friday, March 17, 2006 at 11E/10C/8P to discuss the fourth quarter and full year 2005 financial and operating results. Expect Arena to issue a press release summarizing these results the same morning. This is very significant as the call will afford shareholders, investors, and analysts alike the opportunity to participate in a forum that will allow a Q & A session with President & CEO Tim Rochford and Chairman Stan McCabe. The call certainly will increase both transparency and no doubt Arena's visibility in the investment community. Shareholders certainly applaud the company's decision to conduct the first ever conference call.
Shareholders: Have your Questions Ready for Tim and Stan
To participate, dial 877-407-0782 at least five minutes before the call is to begin. Please reference the Arena Resources conference call.
Click icon to listen to the conference call live.

Tuesday, March 14, 2006
ARD Reserves Exceed Value of GMXR in Both Total and on a per Share Basis
Many people seem to think that GMXR proved reserves are more valuable than those of ARD. However if one takes a closer look it is evident that the ARD proved reserves are far more valuable than those of GMXR.
First lets take a look at the total proven reserves for both GMXR and ARD. The chart below shows the relationship in total proven reserves.
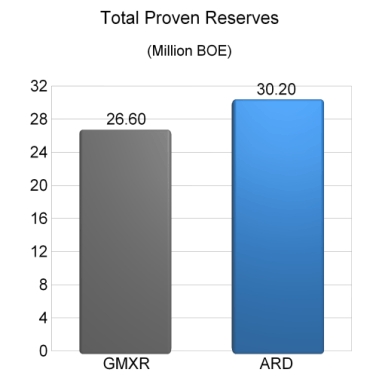
The chart above indicates that GMXR has slightly less proved reserves than ARD. However to have a better understanding of what the value of these reserves are to the share holder we need to determine the number of shares outstanding for both companies. The chart below shows the share count fully diluted for GMXR and ARD.
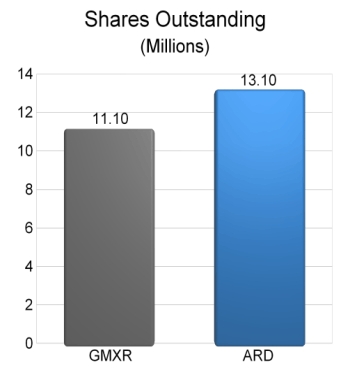
Our calculator indicates that GMXR has slightly more proved BOE per share than that of ARD.
The math looks like this:
GMXR:
26.6 mm BOE/11.1 mm shares=2.39 BOE per share.
ARD
30.2 mm BOE/13.1 mm shares=2.30 BOE per share.
At first glance it appears that the GMXR shares have more value than the ARD shares by virtue of the GMXR shares having more BOE per share. However it must be understood that the ARD and GMXR BOE each have a completely different value. Based on today's closing price for oil ($63.10) and the closing price for natural gas ($7.16) we can derive the following values per BOE for both GMXR and ARD:
GMXR: $42.96*
*(SEC says 1 BOE = 6 mcfe; $7.16 X 6 = $42.96)
ARD: $60**
**(Estimate based on fact that ARD also produces small amount of NG)
If we multiply the above BOE valuations by the number of BOE per share we can determine the Oil and Gas (O&G) assets per share valuation.
The math looks like this:
GMXR $42.96 X 2.39 = $102.67
ARD $ 60 X 2.3 = $138
With the above calculations it seems that ARD has a $35.33 advantage over GMXR in terms of O&G assets per share. In percentage terms ARD has over 34% more O&G assets per share.
However we all know that in order to get a more reliable picture of the true intrinsic value of these reserves we must take into account the EBIT that each BOE produces. The chart below depicts the amount of EBIT per BOE produced in the latest comparable quarter (Q3'05).
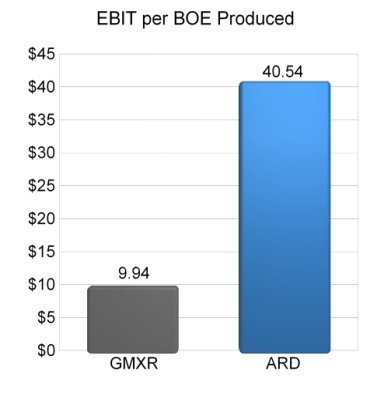
Now that we know the amount of EBIT per BOE produced lets again take a look at the chart that depicts the total proved BOE for each company.
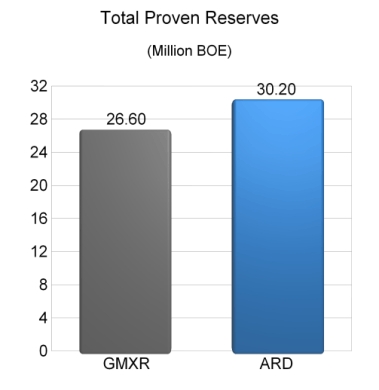
Based on the above proved reserve totals and the amount of EBIT per BOE produced we can determine the total amount of EBIT to be generated for each company.
The math is as follows:
GMXR:
26.6 mm BOE X $9.94 EBIT/BOE = $264.4 million.
(Lets round the $264.4 to $265 for easier math.)
ARD:
30.2 mm BOE X $40.54 EBIT/BOE = $1.224 BILLION.
With the above facts of GMXR proved reserves capable of generating EBIT of $265 million and ARD proved reserves capable of generating EBIT of $1.224 billion it is clear that ARD is capable of producing over 4.6 X more EBIT than GMXR. The chart below shows the comparison of total proved reserves EBIT.
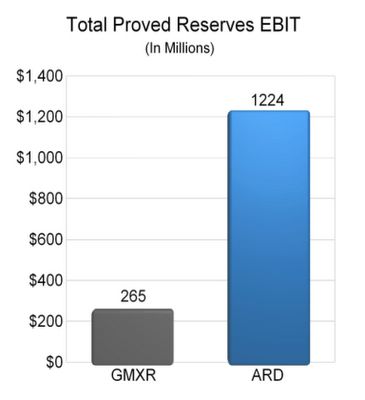
Now that we have the total EBIT that each proved reserve base is capable of producing we must now divide the amounts in the above chart by the total share count for each company to come up with the total EBIT per share.
The math looks like this:
GMXR: $265 million / 11.1 million = $23.87
ARD: $1.224 Billion/ 13.1 million = $93.43
The chart below compares the total proved reserves EBIT per share.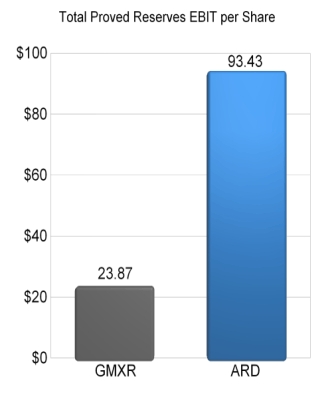
ARD is capable of generating over 3.9X more EBIT per share than GMXR ($93 to $23) even though GMXR has slightly more O&G assets per shares (2.39 to 2.3.) It should be crystal clear that the ARD reserves have much more value both in total and on a per share basis when compared to GMXR.
Based on GMXR current share price of $32.30 GMXR trades at over a 35% premium to the value of the EBIT per share based on the total proved reserves. Keep in mind that my 2006 target price on GMXR of $17 would put the share price below the proved reserve EBIT per share (40% discount to be exact) and would be a more realistic price and much closer to fair value.
In contrast, ARD current share price of $28.28 trades at a 230% discount to the EBIT per share based on total proved reserves. My 2006 price target on ARD of $60 would put ARD shares closer to a fair valuation and reduce the discount from 230% to a more reasonable 55% discount.
In summary it is easy to see that many investors are overestimating GMXR intrinsic value while at the same time grossly underestimating ARD intrinsic value. Valuing both GMXR and ARD reserves based on the amount of profit derived from each BOE and the actual number of BOE proved reserves per share it is easy to see that ARD shares have a much higher intrinsic value. This is a primary reason why ARD shares deserve to have a valuation that not only exceeds that of GMXR but exceeds that of GMXR by a wide margin. Even if GMXR proved reserves were doubled, ARD would still have more total proved reserves EBIT as well as proved reserves EBIT per share. Look for ARD share valuation to surpass that of GMXR in 2006 as the market begins to takes notice of these facts.Legislation Introduced Could Force GMXR Shareholders to Re-Examine Valuation of Shares
There is legislation regarding oil and gas mergers that could gain momentum as congress and examines the issues of rising oil and gas prices. While it is a political hot potato to legislate windfall profits taxes (they don't work), restricting mergers and acquisitions in the name of increased competition and lower prices is something most legislators would think is reasonable. If a bill like this gains momentum this would force GMXR shareholders to take a hard look at the company's business operation of NG production as a GMXR buyout would no longer be a "slam dunk."
(Keep in mind that a GMXR buyout would no longer be a "slam dunk" if NG prices would drift below $6.50 per Mcfe...as margins would not be attractive for a potential suitor.)
EXAMINATION OF GMXR BUSINESS OPERATIONS
As I have pointed out it should be very clear that GMXR is a high cost producer of NG...not a low cost producer. With current prices there is very little margin of error between a profit and a loss for the quarter.
Case in Point:
With $6.50 NG the value of a GMXR BOE = $39
($6.50 X 6* = $39)
*SEC says 6mcfe = 1 BOE.
The difference between total cost per BOE and total revenue per BOE based on Q3'05 and $6.50 NG is:
Total Revenue per BOE: $39
Total Cost per BOE: $29.06*
Net Margin per BOE: $9.94
*Data taken from graph derived from various SEC filings.
(To illustrate how small the $9.94 GMXR net margin per BOE produced basis is it should be noted that ARD margin per BOE produced is about $40 or over 4X that of GMXR based based on $60 oil. It should also be noted that oil producers typically have a cost profile that is much higher than that of gas producers. With that said it should be crystal clear that GMXR cost structure is sky high while ARD cost structure is impossibly low.)
What is the affect of a 10% decline in NG prices?
Total revenue per BOE produced would drop from $39 to $35.10.
(Lets assume total cost per BOE produced would stay the same at $29.06.)
With a BOE of NG now valued at $35.10 now the margin would shrink from $9.94 to $6.04.
($35.10 - $29.06 = $6.04)
The reduction in Net Profit Margin per BOE as a result of the 10% decrease in NG prices would be $3.90
($9.94 - $6.04 = $3.90)
This ($3.90) represents a decrease of 39.2% in net margin per BOE produced.
($3.90 / $9.94 = .392)
My estimate for GMXR 2006 EPS is $0.67 based on $6.50 NG. With a 10% decline in NG prices from $6.50 to $5.85 there would be a decline of 39.2% in net profits.
($0.67 X .392 = $0.26)
That would reduce 2006 EPS from $0.67 to $0.41.
With a PE of 25 that would reduce the target price from $17 to $10.25
($0.41 X 25 = $10.25.)
My point of this discussion is to illustrate how close GMXR is to going off the edge of a cliff; The affects of the high cost structure on attracting a potential suitor; The realities of 2006 EPS analysts estimates being grossly overstated and the consequential CONTINUED future downward revisions of EPS.
Friday, March 10, 2006
GMXR Conference Call Hints at 2006 Capex Program Being Derailed if Natural Gas Prices Should go any Lower
I would suggest that everyone go to 13 minutes 10 seconds on the audio and listen to the first question out of the que during the Q & A session.
(Note: You may want to open up a second window so you can read the transcript and listen to the audio at the same time.)
Click here to listen to the Call.
The first question was from the line of Eric Hagen - Analyst at First Albany. The Q&A begins at about 13 minutes and 10 seconds into the C.C. Pay close attention to the last sentence of the transcript. (The devil is in the details!)
Here is the transcript:

*CFO Ken Kenworthy Sr.*
Eric: "Hi Ken... and Ken. Ahh quick question about your financing of this years drilling program: ahh, have you made any progress on getting another credit facility in place and um given the recent pull back in gas prices do you think you might have to curtail your drilling if it continues?"
Ken Sr: "Ahh we have several proposals... Financing proposals and we're working through them and and actually we are pursuing the best term and best rate ahhhhh...it appears it isn't gonna be a problem. Ahh, we're probably going to get $50 million into debt of some sort. Ahh..the best...the status is is we just need to find the best deal."
Eric: "Ok so it should be no problem executing on the program this year then... Ken? The..."
Ken Sr: "Should not be."
Eric: "Ok."
Ken Sr: "Unless the commodity prices collapse of course."
End Transcript...
*CFO Ken Kenworthy Sr. *
Did you hear what KEN mumbled at the end? The part that he mumbled should have been the part that was annunciated with clarity and emphasis. Instead he tried to do the old mumbling trick...trying to slip a zinger in under the radar of the listeners. That just happened to be one of the most important statements in the entire conference call that listeners NEEDED to latch onto. With that said it should come as no surprise that if NG goes lower GMXR will be unable to go forward with their drilling program. That is how close to the edge they are driving this company. They are being RECKLESS with the company. There is very little margin of error for the company or shareholders. I have been table pounding all along that GMXR of all companies should NOT be taking such an aggressive stand in the 2006 CAPEX program given the fact that their revenue per BOE produced is worth $39 based on $6.50 NG. Also with their costs up over $29.06 there is only a margin of $9.94 per BOE produced. That is razor thin folks. If NG drops to say $5.00 per Mcfe then each GMXR BOE will only be worth $30. With rising costs for drilling, workers, etc I see the costs of $29.06 per BOE produced rising above $30. With that said GMXR is facing NG production at a loss! If you have your heart set on owning NG then I would highly recommend you think about a low cost producer like UPL. They can be profitable with NG prices under $2.75.
GMXR is very near a cliff right now. The reserves in the ground won't be able to prevent an early collapse of share price or market cap if NG prices should go any lower. Keep in mind that my $17 fair value assumes NG prices of $6.50. If NG prices would sink lower than $6.50 per mcfe then a share price of $17 would be unsustainable. Production at a loss would bring early selling to GMXR shares and my target price of $17 would be reached sooner than anticipated.
Thursday, March 09, 2006
ARD is a an Easy Double in 2006 while GMXR is Headed Lower
My Open Letter to GMXR Shareholders (See Open Letter here) details in the latest comparable period (Q3'05) the margin between revenue of each "GMXR BOE" generated and total cost per BOE produced. Keep in mind that a "GMXR BOE" is comprised of 6 mcfe (SEC says 6mcf = 1 BOE.)
I also examined the margin between the value of an "ARD BOE" and ARD total cost per BOE produced. Note that SEC says 1 BBL Oil = 1 BOE. The Value of each BOE is as follows:
GMXR: $39*
ARD: $58**
*based on $6.50 per Mcf
**based on $60 per Bbl of CL
(Click here to see total cost per BOE produced for both GMXR and ARD.)
The resultant margin between VALUE of each BOE and TOTAL COST OF EACH BOE PRODUCED is as follows:
GMXR: $9.94
ARD: $40.54
ARD is scheduled to produce a higher amount of BOE than GMXR in 2006.
GMXR Estimates are as follows:
First Albany Capital: 1,068,333 BOE
Ferris, Baker Watts, Inc.: 997,238 BOE
ARD Estimates are as follows:
Hibernia: 1,102,440 BOE
C.K. Cooper: 1,156,000 BOE*
M.S.Howells: 1,240,000 BOE*
DE Research: 1,089,000 BOE*
*(Note: Not posted on ARD website but available via Investor Relations)
The average GMXR 2006 production estimate:
1,032,785 BOE
The average ARD 2006 production estimate:
1,146,860 BOE
ARD is projected to produce 11% more BOE in 2006 than GMXR!
However to keep the math simple lets assume that both companies produce 1,000,000 BOE. 2006 EBIT will be as follows:
GMXR: $9.94 million.
ARD: $40.54 million.
Lets assume that each company pays 25% in taxes.
The 2006 net income would be as follows:
GMXR: $7.45 million
ARD: $30.40 million
Assume shares outstanding as follows:
GMXR: 11.1 million shares
ARD: 13.1 million shares
2006 EPS would be as follows:
GMXR: $0.67
ARD: $2.32
ARD has the more compelling earnings growth potential. Therefore it deserves a higher multiple. However to illustrate why ARD is the company that is GROSSLY UNDERVALUED with the EXTREMELY COMPELLING INVESTMENT POTENTIAL and why GMXR is GROSSLY OVERVALUED with ZERO COMPELLING INVESTMENT POTENTIAL lets give each company an identical PE multiple of 25.
EPS X PE = Share price.
GMXR: $0.67 X 25 = $16.75
ARD: $2.32 X 25 = $58
Since ARD has the higher growth in production, higher margin for each BOE produced, lower cost structure, stronger balance sheet and better fundamentals ARD deserves a higher PE multiple than GMXR. (Not to mention that ARD mgmt already has experience in selling a public company to a larger company. They sold NYSE Listed Magnum Hunter Resources to Cimarex.) Also keep in mind that ARD is scheduled to produce 11% more BOE in 2006 than GMXR therefore the estimated fair street value of $58 is extremely conservative. The very fact that ARD shares are priced at $27 and have a fair street value of at least $58 based on current CL prices is why I am table pounding this stock as a VERY STRONG BUY. ARD is an easy double in 2006.
On the otherhand I"m also table pounding GMXR as a VERY STRONG SELL based on the fact that it is currently priced at $30 with a fair street value of $17. I'll continue to blog about this gross imbalance in value between ARD and GMXR. I would recommend GMXR shareholders to profit from irrational market by selling the GMXR shares and purchasing ARD shares. It would be very prudent to trade in your overvalued GMXR shares while they still have a higher "currency" value over the undervalued ARD shares.
Note: Many GMXR shareholders have agendas. (They don't want you to sell your shares before they do!) I have no agenda other than to educate and raise the red flags on GMXR overvaluation! I am neither long nor short GMXR.
Wednesday, March 08, 2006
Notes from the Tim Rochford interview:
- In 2005 we will drill 45 wells
- In 2006 we will drill 120 - 130 wells. (Nearly 3X as many wells as in 2005.)
- 500 drilling locations at F-M.
- 200 of the 500 locations are in the proved category.
- 300+ drilling locations on F-M property will come to proved category in next "12-18-24 months"
- "Look to see this company continue to grow production and cashflow but I think most importantly net asset value per share."
Click here to listen to the Tim Rochford interview.
Math:
increased reserves 8 million BOE excluding acquisitions in 2005 based on 45 locations drilled.In 2006 nearly 3X as many locations drilled when compared to 2005. Therefore if ARD reserves grew 8 million boe based on 45 wells drilled then in 2006 ARD would expect to see 24 million in added proved reserves as a result of increasing drilled locations by nearly threefold. (8 X 3 = 24.)24 + 30.2 =54.2 million BOE proved reserves.54.2 - 1 million production = 53.2 million BOE proved reserves at year end.Assuming growth of share count to 14.1 million shares we area looking at total oil assets per share of 3.77 BOE per share.
With CL price of $62 per BOE we have oil assets per share of $230. (OAPS of 8.42X share price.)
Assuming $70 oil we have oil assets per share of $263 (OAPS of 9.63X share price.)
Assuming $80 oil we have oil assets per share of $301. (OAPS of 11.02X share price.)
OAPS = Oil Assets per Share.
2006 will be a year in which ARD shareholders will be richly rewarded. Tim Rochford emphasizes growth in Net Asset Value per Share as being most important. With ARD drilling program it wouldn't be out of realm of possibility for proved reserves to grow by over 76% in 2006 based on the drill bit alone. No Pump. Just facts.
ARD is a strong buy.
For those of you who use my ARD purchases as a contrarian indicator I want to make an announcement about Wednesday March 8, 2006. On this day (today) I will purchase more ARD shares. So if you think it is time to sell when I buy then please go ahead and dump your shares as fast and as furious as you can at the open. You are more than welcomed to just dump your holdings like there ain't no tomorrow.
I'm buying another big block.

